


Introduction to Graphs Class 8 Extra Questions and Answers Free PDF Download
Very Short Answer Type Questions: (1 Marks)
1. The point where $x - $ axis and $y - $ axis meet is called $\_\_\_\_\_\_\_\_\_\_$?
Ans: Origin
2. In which quadrant does the point $s( - 3,2)$ lie?
(a) II
(b) I
(c) III
(d) IV
Ans: (a) II
3. On which axis does the point $(0, - 6)$ lie
(a) ${\text{x}} - $ axis
(b) ${\text{y}} - $ axis
(c) origin
(d) None of these
Ans: (b) $y - $ axis
4. Perpendicular distance of the point $(2,3)$ from ${\text{x}} - $ axis is
(a) $2$
(b) $3$
(c) $0$
(d) None of these
Ans: (b) $3$
5. A pictorial representation of data in the form of rectangular bars to show comparison among categories is called $\_\_\_\_\_\_\_\_\_\_$?
Ans: Bar graph
6. The co-ordinates of origin is
(a) $({\text{x}},0)$
(b) $(0,y)$
(c) $(0,0)$
(d) None of these
Ans: (c) $(0,0)$
7. What is a pie graph?
Ans: Data can be represented by dividing a circle into sectors. This type of representation of data is called a pic graph. It shows us the relation of parts to the whole.
Short Answer Type Questions: (2 Marks)
8. Find the co-ordinates of the points $A,{\text{ }}B,{\text{ }}C,{\text{ }}D$ from the graph
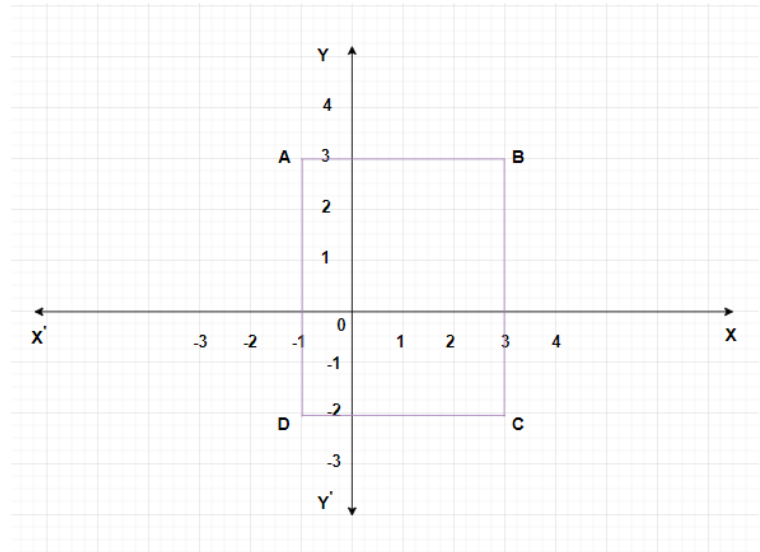
Ans: The co-ordinates of the point
$A = ( - 1,3)$
$B = (3,3)$
$C = ( - 2,3)$
$D = ( - 1, - 2)$
9. If a man moves $6$ units right due (east) from point $A$, then find the co-ordinates of his new position.
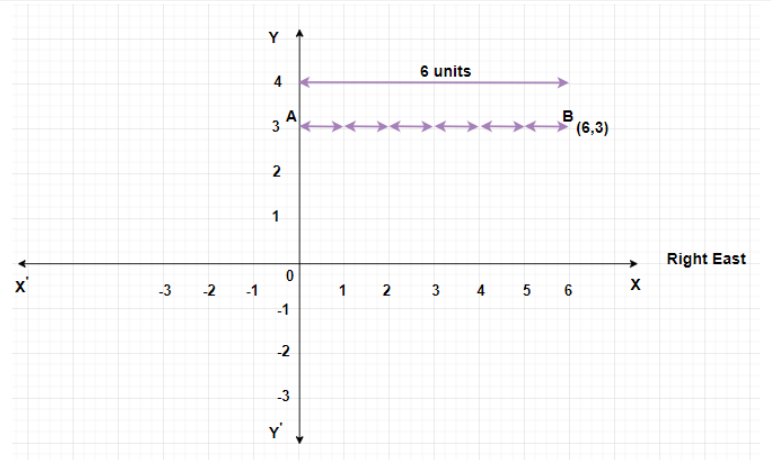
Ans: The position of point $A = (3,0)$
If a man moves $6$ units right from point $A$ then new position of man will be at $B = (6,3)$.
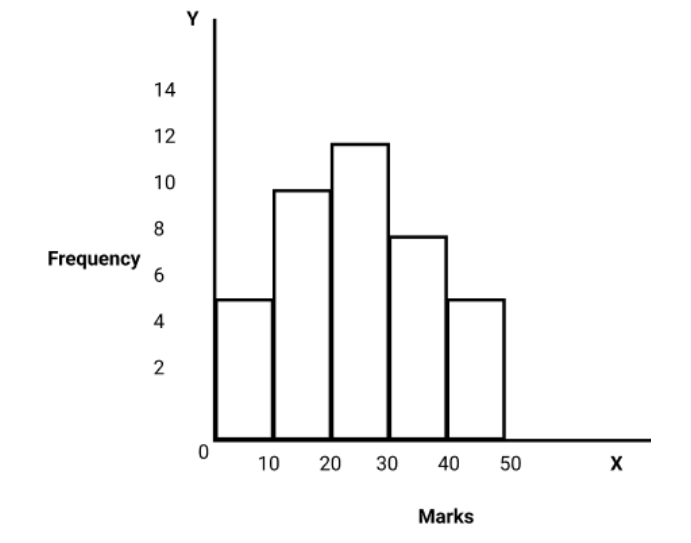
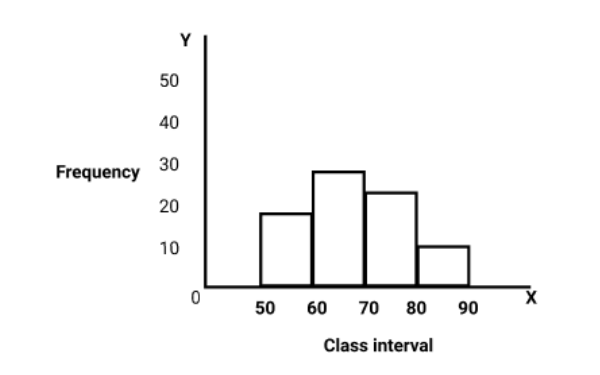
10. In a class of $40$ students, the marks obtained in maths subject (out of $50$) are as given below
Draw histogram?
Ans:
11. Find the time taken by a body to cover $30$ meters. Hence find speed?
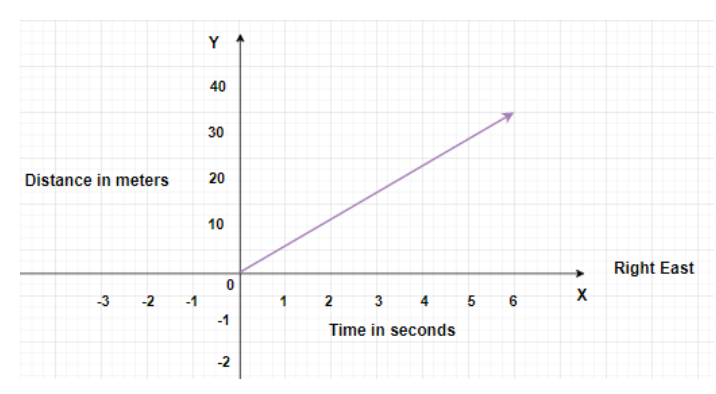
Ans: Time taken to cover a distance of $30\;{\text{m}} = 6$ seconds
${\text{Speed }} = \dfrac{{{\text{ Distance covered }}}}{{{\text{ Time taken }}}}$
${\text{Speed}} = \dfrac{{30m}}{{6s}} = 5m{s^{ - 1}}$
12. Plot the following points. Verify if they lie on a line? $(1,3),{\text{ }}(2,3),{\text{ }}(3,3),{\text{ }}(4,3)$
Ans: We plot the given point on a graph to check if they lie on line
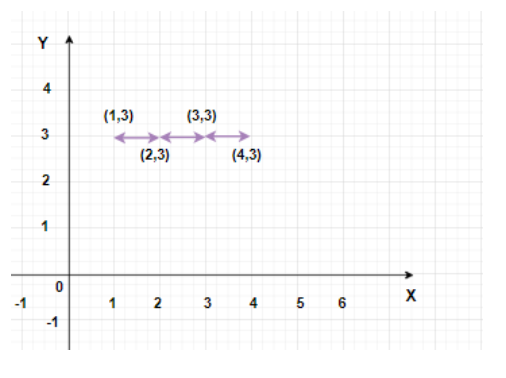
Yes, they lie on a line.
Short Answer Type Questions: (3 Marks)
13. Draw a line passing through $(3,1)$ and $(1,3)$. Find the co-ordinates of the points at which this line meets the $x - $ axis and $y - $ axis.
Ans: The co-ordinates of the point on $x - $ axis and $y - $ axis is where the line meets axes.
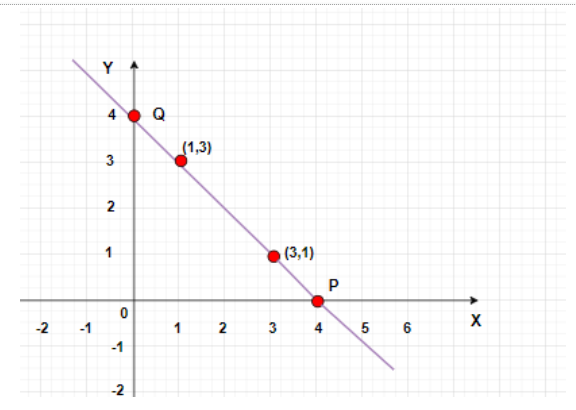
$x - $ axis, $P = (4,0)$
$y - $ axis, $Q = (0,4)$
14. Following graph gives the movement of a car from a town $A$ to town $D$. Study the graph and answer the following questions:
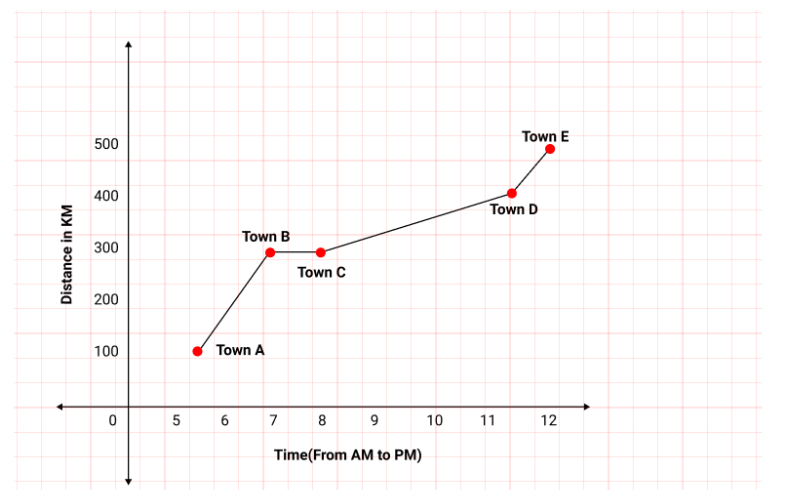
(a) What is the distance between town $A$ and town $D$ ?
Ans: $A = (5.5,100) = ({X_1},{Y_1})$
$D = (11.5,500) = ({X_2},{Y_2})$
(b) At what time did car start from town $A$?
Ans: Car starts from town $A$ by $5:30$ am.
(c) Where did the car stop and for what duration?
Ans: Car stopped at town $B$ by $1$ hour duration.
15. Plot the points $A(4,0)$ and $B(0,3)$ on the graph. Also find the length of hypotenuse of triangle $AOB$
Ans: $OA = x - $ co-ordinate of point $A = 4$
${\text{OB}} = y - $ co-ordinate of point $B = 3$
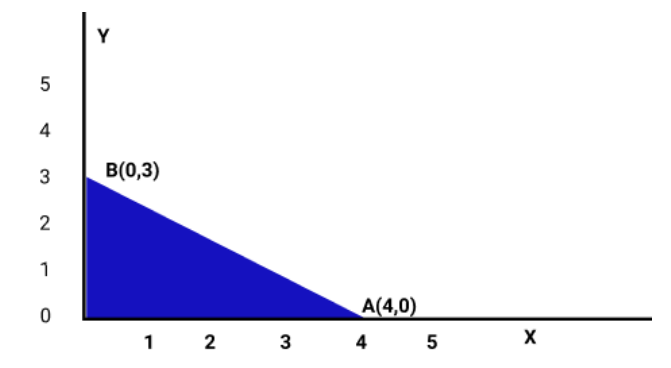
Hypotenuse $AB = \sqrt {{4^2} + {3^2}} $
$AB = \sqrt {16 + 9} $
$AB = \sqrt {25} $
$AB = 5.$
16. Make a table of values for the function $y = 4x$, From the table find the value's of $y$ when $x = 4$ and $x = 5$
Ans: $y = 4x$
At $x = 4$, $y = 4(4) = 16$
$x = 5$, $y = 4(5) = 20$
17. State true or false
(a) A point whose $x - $co-ordinates is zero and $y - $ co-ordinates is non-zero will lie on the $y - $axis
(b) The co-ordinates of the origin are $(0,0)$
(c) A point whose $y - $co-ordinates is zero and $x - $ co-ordinates is $4$ will lie on the $y - $axis
Ans:
(a) True
(b) True
(c) False
18. From the given graph, compute the difference between the sales of $2013$ and $2015$
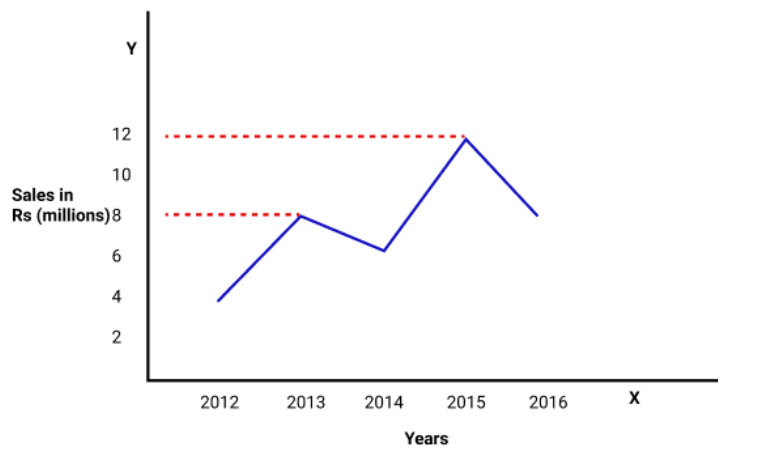
In which year sales are high?
Ans:
Sales in $2015 - 12$ million
Sales in $2013 - 8$ million
The difference between the sales in $2015$ and 2013
$ = 12 - 8 = 4$ million
In $2015$ the sales are high.
19. Draw the histogram to represent the following data and define linear graph.
Ans:
A line graph which is a whole unbroken line is called a linear graph.
20. Plot the points $A(2,3),{\text{ }}B(5,3),{\text{ }}C(5,5)$ and $D(2,5)$ on graph. Connect the points in that order. So as to get a closed figure ${\text{ABCD}}$. What type of figure do you get?
Ans:
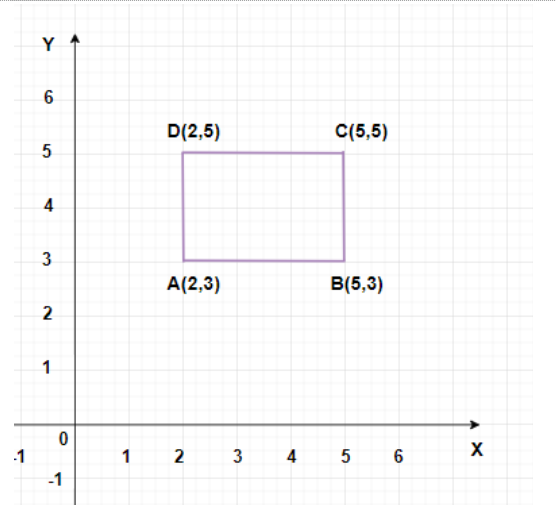
The figure ${\text{ABCD}}$ obtained is a rectangle.
Long Answer Type Questions: (5 Marks)
21. Reena deposited Rs$12,000$ in a bank at the rate of $10\% $ per annum. Draw a linear graph showing the relationship between the time and simple interest. Also find the simple interest for $4$ years.
Ans: $P = 12,000$
$R = 10\% $
Simple interest for one year $ = \dfrac{{PTR}}{{100}}$
$ = 12000 \times \dfrac{{10}}{{100}} \times 1$
$ = 1200$
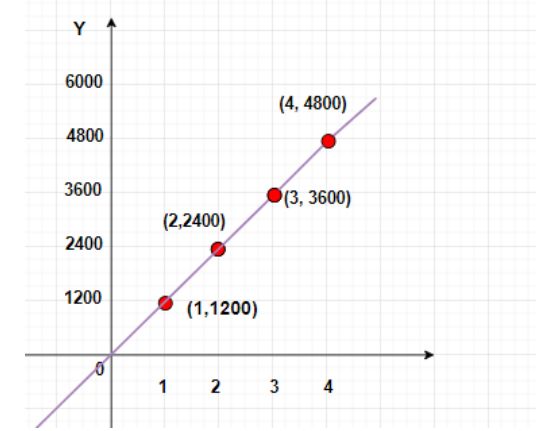
Simple interest after $4$ years is $4800$.
22. Hundred students from a certain locality use different modes of travelling to school as given below. Draw a bar graph which is maximum mode of travel?
Ans: Scale: on $x - $ axis $1{\text{cm}} = 1$ unit
On $y - $ axis $1\;{\text{cm}} = 8$ units
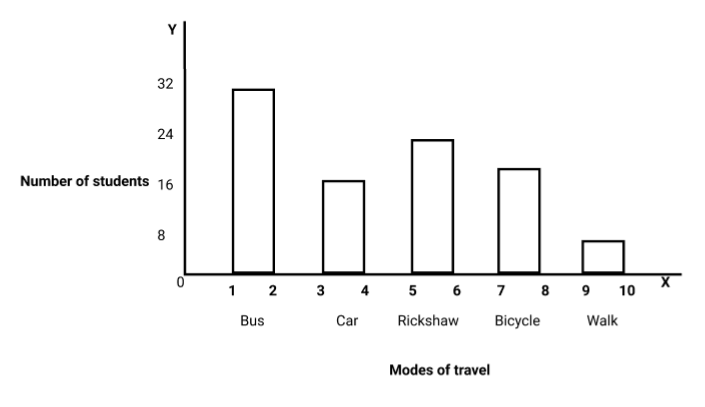
Maximum mode of travel is bus.
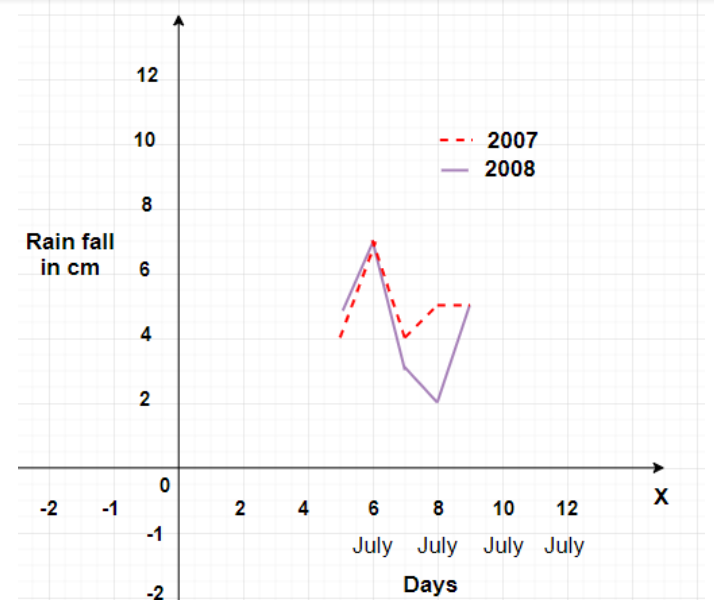
23. Study the following graph and answer the following questions
Ans:
(a) Which year has better rainfall?
Ans: $2007$
(b) On how many days the rainfall was same?
Ans: For ${8^{{\text{th }}}}$ July and ${9^{{\text{th }}}}$ July of $2007$ the rainfall was same.
(c) Name the only date on which $2008$ got more rainfall?
Ans: On ${6^{{\text{n }}}}$ July of $2008$ rainfall is max $(7\;{\text{cm}})$
(d) On which date the difference between the rainfall of the $2$ years was biggest?
Ans: ${8^{{\text{hy }}}}$ July
(e) What is the difference between the rainfall of $2007$ and $2008$ on July ${8^{{\text{th }}}}$ ?
Ans: $3\;{\text{cm}}$ of difference
On July ${8^{{\text{th }}}}$ in $2007 = $ Rainfall $ = 5{\text{cm}}$
On July ${8^{{\text{th }}}}$ in $2008 = $ Rainfall $ = 2\;{\text{cm}}$
Difference $ = 5 - 2 = 3\;{\text{cm}}$
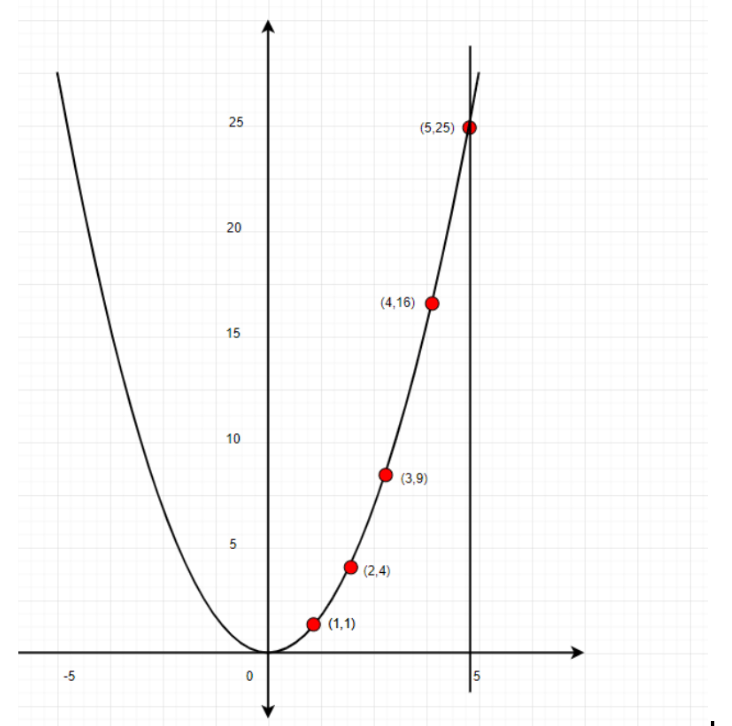
24. If $y = {x^2}$, then draw a graph.
Ans:
The graph is drawn as follows:
Scale: On $x - $ axis $5$ units $ = 1{\text{cm}}$
On $y - $ axis $10$ units $ = 1{\text{cm}}$
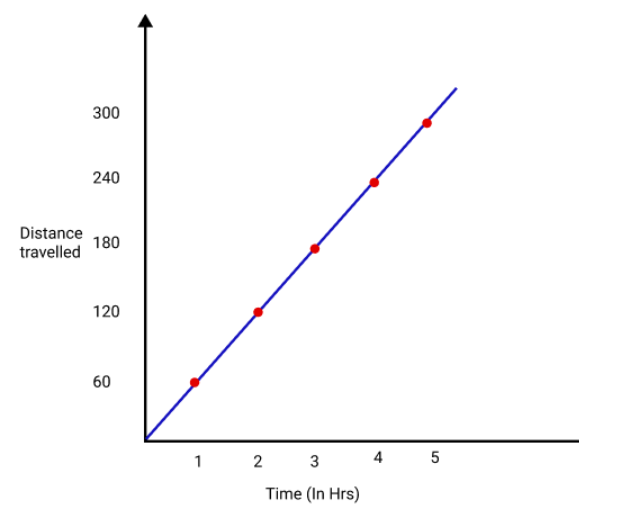
25. A train is moving at a constant speed of $60\;{\text{km}}{{\text{h}}^{ - 1}}$. Draw a distance - time graph
(a) How far will it travel in $2$ hours $30$ minutes
(b) Find the time required to cover a distance of $260\;{\text{km}}.$
Ans:
Speed of train$ = 60\;{\text{km}}/{\text{hr}}$
Table for distance - time graph is as follows:
Scale:
On $x - $ axis $1\;{\text{cm}} = 1{\text{hr}}$
On $y - $ axis $1\;{\text{cm = }}60\;{\text{km}}$
(a) Distance covered in $2$ hours $30$ minutes$ = 150\;{\text{km}}$
(b) Time required to cover a distance of $260\;{\text{km}} = 4.33$ hrs.
What are the Benefits of Important Questions from Vedantu for Class 8 Maths Chapter 13 - Introduction to Graph
Focus on key topics for efficient studying.
Prepares students for exams and reduces anxiety.
Reinforces understanding of fundamental concepts.
Teaches effective time management.
Enables self-assessment and progress tracking.
Strategic approach for higher scores.
Covers a wide range of topics for comprehensive understanding.
Supports exam preparation and boosts confidence.
Conclusion
Reviewing all the crucial questions for Class 8 Maths Chapter 13 - “Introduction to Graph” provides students with a solid grasp of the chapter's topics. The extra and important questions for Class 8 Maths Chapter 13 - “Introduction to Graph” engage in a concept-focused discussion encompassing all chapter themes. This question-and-answer method proves time-saving during exam prep, offering an efficient way to revise the chapter and enhance understanding. Practicing these important questions streamlines preparation and boosts confidence for the upcoming exams.
Related Study Materials for CBSE Class 8 Maths Chapter 13
CBSE Class 8 Maths Chapter-wise Important Questions
Other Important Related Links for CBSE Class 8 Maths

FAQs on Important Questions For Class 8 Maths Chapter 13 Introduction to Graphs - 2025-26
1. What types of graphs are most important to practise for the Class 8 Maths exam from Chapter 13, based on the 2025-26 syllabus?
For the CBSE Class 8 Maths exam, you should focus on four key types of graphs from Chapter 13. Important questions are frequently framed around:
- Line Graphs: These are crucial for showing how data changes over time. Expect questions that require you to plot a line graph from a table of values or interpret a given one.
- Bar Graphs: Used for comparing discrete categories. Questions might ask you to draw a bar graph to represent data like marks in different subjects or production over years.
- Histograms: These are important for representing data in continuous intervals. A common question involves creating a histogram from a frequency distribution table.
- Pie Charts (or Circle Graphs): Used to show parts of a whole. Questions often involve calculating angles for each sector and drawing the chart.
2. What kind of 3-mark or 5-mark important questions can be expected from 'Introduction to Graphs'?
In the Class 8 exams, higher-mark questions from this chapter test your application and interpretation skills. Expect questions such as:
- Plotting a Linear Graph: You may be given a linear equation or a table of (x, y) values and asked to plot the corresponding straight-line graph on a Cartesian plane. This tests your understanding of coordinates and scale.
- Interpreting a Time-Distance Graph: A 5-mark question could present a complex line graph showing a journey and ask multiple sub-questions about speed, distance covered in a specific time, and periods of rest.
- Creating a Histogram: You might be given raw data and asked to first create a grouped frequency distribution table and then draw a histogram from it, which is a multi-step process often worth more marks.
3. What are the key steps to ensure I score full marks when plotting a graph in my exam?
To score full marks on a graph-based question, examiners look for precision and correct labelling. Follow these steps:
- Title: Always give your graph a suitable title that describes what it represents.
- Axes Labelling: Clearly label the x-axis and the y-axis with the quantities they represent (e.g., 'Time in hours', 'Temperature in °C').
- Choosing a Scale: Select a clear and consistent scale for both axes. The scale should be easy to read and large enough to use the graph paper effectively. Mention the scale clearly on the graph (e.g., On x-axis, 1 cm = 5 units).
- Plotting Points: Mark the points with a sharp pencil as small dots and circle them for clarity. Ensure the coordinates are plotted accurately.
- Joining Points: Use a ruler to join the points for a line graph or draw neat bars for a bar graph/histogram.
4. What is the main difference between a bar graph and a histogram? When are they used in exam questions?
This is a common point of confusion and an important concept. The key difference lies in the type of data they represent. A bar graph is used to display discrete, separate categories (e.g., favourite colours, number of students in different classes). There are gaps between the bars to show they are distinct. In contrast, a histogram is used to display continuous data that is grouped into intervals (e.g., height of students in the range 140-145 cm, 145-150 cm, etc.). There are no gaps between the bars in a histogram, indicating the continuous nature of the data.
5. Why is mastering Chapter 13, 'Introduction to Graphs,' considered crucial for success in higher classes like 9 and 10?
Mastering graphs in Class 8 is fundamental because it is a foundational skill for several advanced topics. In Class 9 and 10, this knowledge is directly applied in:
- Coordinate Geometry: The concepts of plotting points (abscissa and ordinate) are the building blocks of this entire unit.
- Linear Equations in Two Variables: You will be required to represent linear equations graphically as straight lines.
- Statistics: You will create more complex graphs like frequency polygons and ogives, which build upon the histogram concept.
- Science (especially Physics): Graphs are essential for representing motion (distance-time and velocity-time graphs) and other scientific relationships.
6. What types of short-answer or MCQ questions are frequently asked from this chapter?
For 1-mark questions, you can expect direct and concept-checking problems. Important types include:
- Identifying the coordinates of a point plotted on a graph.
- Finding the abscissa (x-coordinate) or ordinate (y-coordinate) of a given point.
- A question asking which axis a point like (0, 5) or (3, 0) lies on.
- Simple interpretation from a bar graph, like 'Which category has the highest value?'.
- Determining if a statement about a graph is true or false.
7. How do you decide the correct 'scale' for a graph when the data values are very large or uneven?
Choosing the right scale is a critical thinking skill. First, find the range of your data (highest value - lowest value) for both axes. Then, look at the available space on your graph paper. Divide the range by the number of available grid units to get an idea for the scale. For instance, if your data goes up to 500 and you have 10 cm of space, a scale of 1 cm = 50 units would be appropriate. If the data starts from a large value (e.g., 400), you can use a 'kink' or 'break' on the axis to show that you are skipping the initial numbers, allowing you to use a more detailed scale for the relevant data range.
8. Can a line graph be non-linear? What does a straight line on a graph signify in the context of Chapter 13?
Yes, a line graph can be non-linear. A line graph is simply a graph formed by joining plotted points. If the relationship between the variables is not constant, the resulting graph will be a series of connected line segments with different slopes, forming a 'broken' line. A straight line (a linear graph) is a special case that is very important. It signifies a uniform or constant rate of change between the two variables. For example, in a distance-time graph, a straight line means the object is moving at a constant speed.