


Data Handling - Exercise-wise Questions and Answers For Class 8 Maths - Free PDF Download
NCERT for Data Handling Class 8 Maths Chapter 4 Solutions by Vedantu, is a crucial chapter helping students understand how to deal with data in various forms. This chapter teaches students how to collect data, organize it into different types like tally marks or tables, and then represent it graphically using bar graphs, pie charts, and histograms. Vedantu's NCERT Solutions for Chapter 4 Data Handling Class 8 PDF offer clear explanations and step-by-step guidance to help students tackle the problems effectively.
 Table of Content
NCERT solutions for Class 8 Maths are designed to make learning easy and enjoyable, providing a solid foundation in data handling concepts. Through these solutions, students can learn how to interpret graphs, calculate measures of central tendency like mean, median, and mode, and draw conclusions from the data presented. By practising with these solutions, students can build confidence in their understanding and excel in their studies.
Formulas Used in Class 8 Chapter 4 Exercises
angle of sector = $\left ( \frac{Value of item}{sum of all items} \right ) \times 360\ degree $
Probability of an Event = $\left ( \frac{Number of favorable outcomes}{Total number of outcomes of the experiment} \right )$
Access Exercise wise NCERT Solutions for Class 8 Maths Chapter 4
Exercise 4.1: This exercise consists of 5 fully solved questions. This exercise deals with collection of data and how to represent the given information in pictorial form through pie charts, bar graphs and histograms.
Exercise 4.2: This Exercise consists of 6 fully solved questions. This exercise deals with Probability, and chance of getting a desired result.
Access NCERT Solutions for Class 8 Maths Chapter 4 – Data Handling
Exercise: 4.1
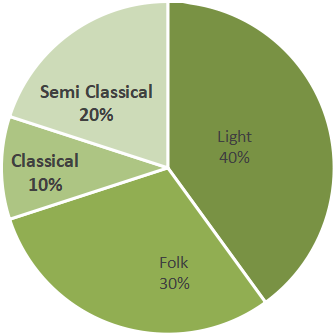
1. A survey was made to find the type of music that a certain group of young people liked in a city.
Adjoining pie chart shows the findings of this survey.
From this pie chart, Ans the following:
(i) If \[\text{20}\] people liked classical music, how many young people were surveyed?
(ii) Which type of music is liked by the maximum number of people?
(iii) If a cassette company were to make \[\text{1000}\] CD’s, how many of each type would they make?
Ans :
(i) Here \[\text{10 }\!\!%\!\!\text{ }\] represents \[\text{100}\] people.
Therefore \[20%\] represents = \[\dfrac{100\times 20}{10}=200\] people.
Hence, \[200\] people were surveyed.
(ii) \[40%\] of people likes light music. So, light music is liked by the maximum number of people.
(iii) Total no. of CD’s to be made by cassette company= \[1000\]
Number of CD’s of classical music = \[\dfrac{10\times 1000}{100}=100\]
Number of CD’s of semi-classical music = \[\dfrac{20\times 1000}{100}=200\]
Number of CD’s of light music = \[\dfrac{40\times 1000}{100}=400\]
Number of CD’s of folk music = \[\dfrac{30\times 1000}{100}=300\]
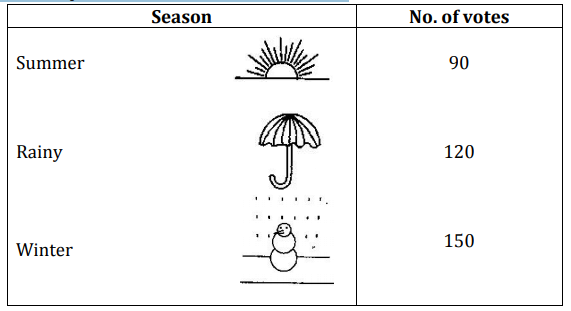
2. A group of \[\text{360}\]people were asked to vote for their favourite season from the three seasons rainy, winter and summer.
(i) Which season got the most votes?
(ii) Find the central angle of each sector.
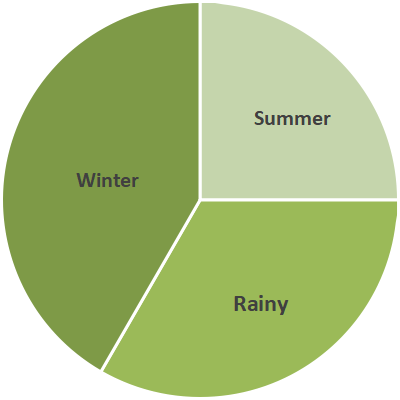
(iii) Draw a pie chart to show this information.
Ans:
(i) Winter season got the greatest number of votes i.e., \[150\].
(ii) Central angle of summer season = \[\dfrac{90{}^\circ \times 360{}^\circ }{360{}^\circ }=90{}^\circ \]
Central angle of rainy season = \[\dfrac{120{}^\circ \times 360{}^\circ }{360{}^\circ }=120{}^\circ \]
Central angle of winter season = \[\dfrac{150{}^\circ \times 360{}^\circ }{360{}^\circ }=150{}^\circ \]
(iii) Pie chart to show the above information:
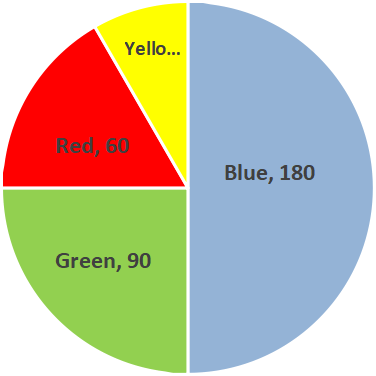
3. Draw a pie chart showing the following information. The table shows the colours preferred by a group of people.
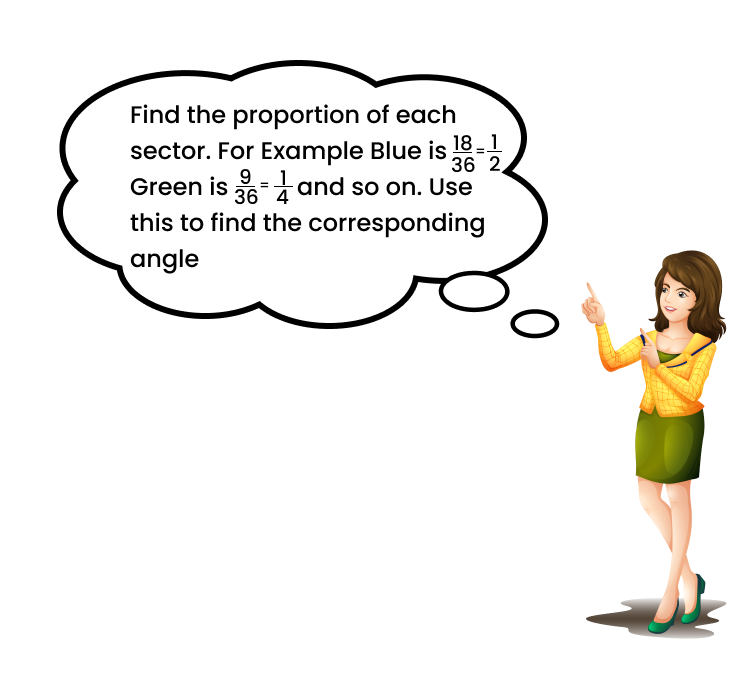
Ans: Here, central angle = \[360{}^\circ \] and total number of people = \[36\]
Pie chart showing above information:
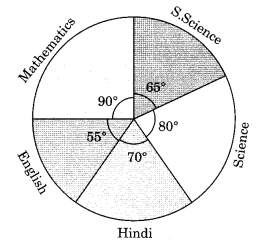
4. The adjoining pie chart gives the marks scored in an examination by a student in Hindi, English, Mathematics, Social Science and Science. If the total marks obtained by the students were \[\text{540}\], Ans the following questions:
(i) In which subject did the student score \[\text{105}\] marks?
(Hint: for \[\text{540}\] marks, the central angle = \[\text{360 }\!\!{}^\circ\!\!\text{ }\] . So, for \[\text{105}\] marks, what is the central angle?)
(ii) How many more marks were obtained by the student in Mathematics than in Hindi?
(iii) Examine whether the sum of the marks obtained in Social Science and Mathematics is more than that in Science and Hindi. (Hint: Just study the central angles)
Ans:
i. The subject in which the student scored \[105\] marks in Hindi.
ii. Marks obtained in Mathematics = \[135\]
Marks obtained in Hindi = \[105\]
Difference = \[135-105=30\]
Thus, \[30\] more marks were obtained by the student in Mathematics than in Hindi.
iii. The sum of marks obtained in Social Science and Mathematics =\[97.5+135=232.5\]
iv. The sum of marks obtained in Science and Hindi = \[120+105=225\]
Yes, the sum of the marks in Social Science and Mathematics is more than the marks in Science and Hindi.
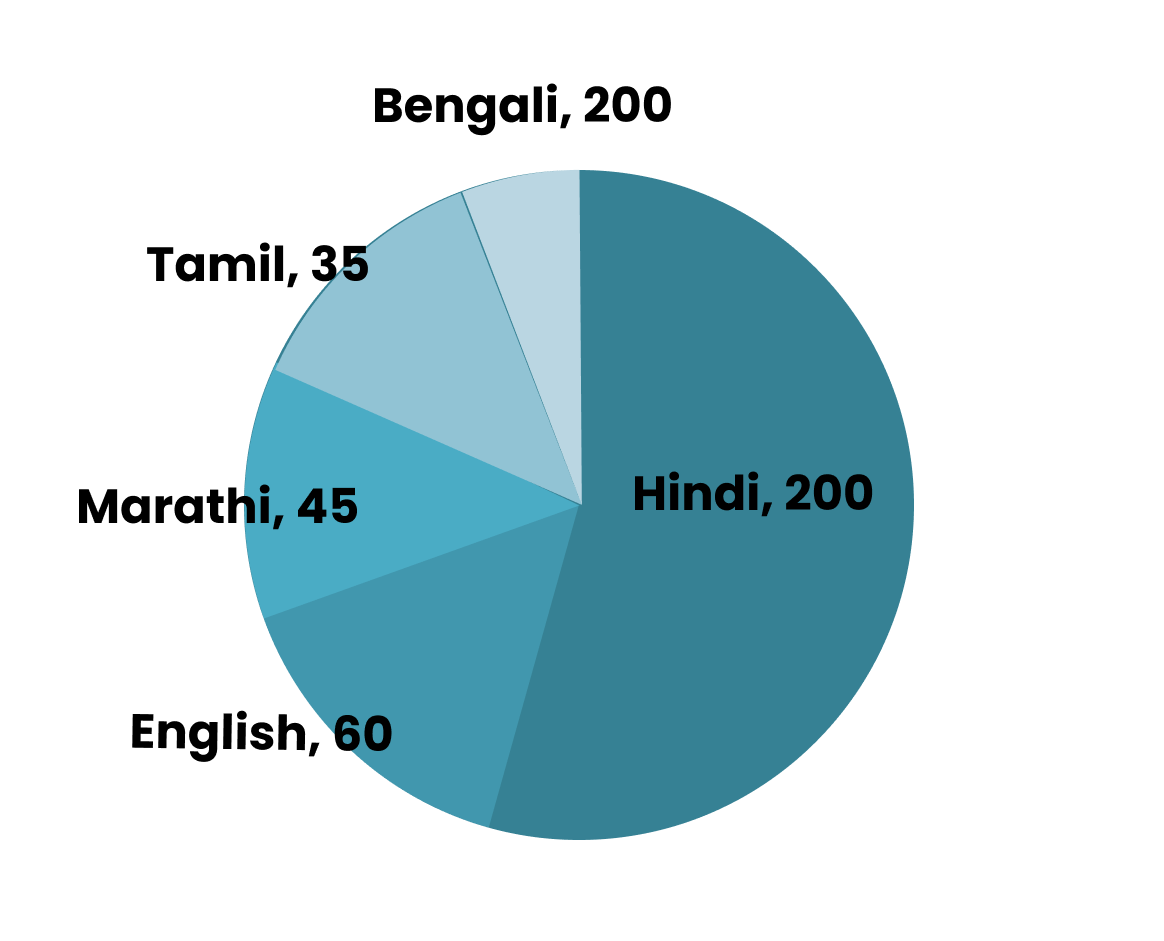
5. The number of students in a hostel, speaking different languages is given below. Display the data in a pie chart.
Ans:
Pie chart for the above given data is as follows:
Exercise: 4.2
1. List the outcomes you can see in these experiments.
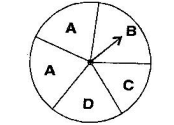
a) Spinning a wheel
b) Tossing two coins together
Ans:
a) There are four letters A, B, C and D in a spinning wheel. So, by spinning the wheel we will get total 4 outcomes.
b) When two coins are tossed together. There will be four possible outcomes: HH, HT, TH, TT.
(H means head and T means tail. HT means head on first coin and tail on second coin and so on.)
2. When a die is thrown, list the outcomes of an event of getting:
(a) a prime number (b) not a prime number
(a) a number greater than \[\text{5}\] (b) a number not greater than \[\text{5}\]
Ans:
(i) (a) Number of prime number between \[1-6\] are \[2,\text{ }3\]and \[5\]. Outcomes of an event of getting a prime number are \[2,\text{ }3\]and \[5\].
(b)Number of not prime number between \[1-6\] are \[1,\text{ 4}\]and \[6\]. Outcomes of an event of not getting a prime number are \[1,\text{ 4}\]and \[6\].
(ii) (a) Outcomes of an event of getting a number greater than \[5\] is \[6\].
(b) Outcomes of an event of not getting a number greater than \[5\] are \[1,\text{ 2, 3, 4}\]and \[5\].
3. Find the:
a. Probability of the pointer stopping on D in (Question 1 (a)).
b. Probability of getting an ace from a well shuffled deck of \[\text{52}\] playing cards.
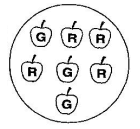
c. Probability of getting a red apple. (See figure alongside)
Ans:
a. In a spinning wheel, there are five pointers A, A, B, C and D i.e., \[5\]outcomes. Pointer stopping at D which is \[1\] outcome.
So, the probability of the pointer stopping on D = \[\dfrac{1}{5}\]
b. In a deck of \[\text{52}\] playing cards, there are \[4\] aces. So, there are \[4\] events of getting an ace.
So, probability of getting an ace = \[\dfrac{4}{52}=\dfrac{1}{13}\]
c. Total number of apples = \[7\]
Number of red apples among all = \[4\]
Probability of getting a red apple = \[\dfrac{4}{7}\]
4. Numbers \[\text{1}\] to \[\text{10}\]are written on ten separate slips (one number on one slip), kept in a box and mixed well. One slip is chosen from the box without looking into it. What is the probability of:
i. getting a number \[\text{6}\].
ii. getting a number less than \[\text{6}\].
iii. getting a number greater than \[\text{6}\].
iv. getting a \[\text{1}\]-digit number.
Ans:
i. Outcome of getting \[6\] from ten separate slips is \[1\]. Therefore, probability of getting a number \[6\] is \[1\].
ii. Numbers less than \[6\] are \[1,\text{ 2, 3, 4}\] and \[5\] which are five. So, total outcomes are \[5\]. Therefore, the probability of getting a number less than \[6\] is \[\dfrac{5}{10}=\dfrac{1}{2}\].
iii. Numbers greater than \[6\] out of ten that are \[7,\text{ 8, 9, 10}\]. So, there are \[4\]possible outcomes. Therefore, the probability of getting a number greater than \[6\] is \[\dfrac{4}{10}=\dfrac{2}{5}\].
iv. One-digit numbers from \[1-10\] are \[1,2,3,4,5,6,7,\text{ 8, 9, 10}\]. Therefore, the probability of getting a one-digit number is \[\dfrac{9}{10}\].
5. If you have a spinning wheel with \[\text{3}\] green sectors, \[\text{1}\] blue sector and \[\text{1}\] red sector, what is the probability of getting a green sector? What is the probability of getting a none-blue sector?
Ans: There are total five sectors (\[3+1+1\]). \[3\] sectors are green out of five sectors.
The probability of getting a green sector is \[\dfrac{3}{5}\].
There is only \[1\] blue sector out of five sectors. Non-blue sectors will be \[5-1=4\] sectors.
The probability of getting a non-blue sector = \[\dfrac{4}{5}\]
6. Find the probability of the events given in Question \[\text{2}\].
Ans: When a die is thrown, there are total six outcomes, i.e., \[1,2,3,4,5\] and \[6\].
(i) (a) \[2,3,5\] are prime numbers. So, there are \[3\] outcomes out of \[6\].
Therefore, probability of getting a prime number = \[\dfrac{3}{6}=\dfrac{1}{2}\]
(b) \[1,4,6\] are non-prime numbers. So, there are 3 outcomes out of 6.
Therefore, probability of getting a non-prime number = \[\dfrac{3}{6}=\dfrac{1}{2}\]
(ii) (a) Only \[6\] is greater than \[5\]. So, there is only one outcome out of \[6\].
Therefore, probability of getting a number greater than 5 = \[\dfrac{1}{6}\]
(b) Numbers not greater than 5 are \[1,2,3,4\] and \[5\]. So there are \[5\] outcomes out of \[6\].
Therefore, probability of not getting a number greater than 5 = \[\dfrac{1}{6}\]
Important Points
Data is the collection of information.
Data can be pictorially represented by using the symbol.
Information can be displayed and compared using bar graph or pie chart.
Double bar graphs can be used to represent two data at the same time.
The data which are unorganized is said to be raw data.
Before converting it into a graph or chart, it is necessary to convert it into organized data.
To minimize the data, can group similar data and keep them in a particular set.
Summary
Numerical Observations that are available to us as unorganized form is called raw data.
We need to organize the data collected systematically in order to draw meaningful inferences.
Each numerical value in data is known as observation.
Class is a group of variables. The difference between the lower limit and the upper limit of a class is called class size or class width.
Class mark is a specific point in the middle of the class interval. The lower limit is included in a class interval but upper limit is excluded.
A collection of observations collected from the direct source is called raw data or primary data.
A collection of observations collected from secondary sources like newspaper, T.V, magazines or the Internet, is called secondary data.
The difference between the highest and the lowest data values is called the range of the data.
A systematic way of arranging the data in the form of a table is called tabulation of data.
The mean or the arithmetic mean is the representation of some given observations in a collection of data. The average of the arithmetic mean (A.M) is given by: Mean = (Sum of all observations/Total number of observations)
The Frequency of the data is the number of times a data value occurs in the set.
The method of representing the data that exhibits the values of the variable and corresponding frequencies, is called the frequency distribution.
Average is a number that represents or expresses the central tendency of a group of observations or data. It is basically the midpoint in a set of data and then dividing the sum of values by their number.
The arithmetic mean is the representation of observations of data.
Arithmetic Mean = (Sum of all observations/Total number of observations)
The mode is the value of the variable in a set of observations, which occurs most frequently. This is the highest occurring data. This representation of the data is called the mode of the data
In a given data arranged in ascending or descending order of magnitude, the value of the middlemost term is called the median of the data. The median gives us the mid-point of an observation in a given data, which is arranged in ascending or descending order.
Note: In a given data, the values are arranged in ascending or descending order.
i. the observations are divided equally in the median.
ii. If the collected data has an odd number of items, the median is the middle number.
iii. If the data has an even number of items, the median is the mean of two middle numbers.
A bar graph is a pictorial representation of numbers using bars of uniform width.
Grouped data can be presented using histogram. Histogram is a kind of bar graph, where the class intervals are shown on horizontal axis and heights of the bars show the frequency of the class interval. In histogram, there is no gap between the class intervals.
The collected data can also be presented using a circle graph or pie chart. To demonstrate the relationship between a whole and its parts, we use pie charts.
In a pie chart, the circle is divided into sectors and the angle of sector = (Value of item/sum of values of all items)x 360°
If you have to find the percentage value of a component in the pie chart then the formula is
((Value of item/sum of values of all items)x 360°) x 100
An experiment is an action that results in some good outcomes. There are some experiments whose outcomes have equal opportunity of occurring and so they are equally likely outcomes.
Favourable outcomes are the outcomes that ensure the occurrences of an event.
What happens, which may or may not happen is called chance. For example, when we throw a coin each time the outcome of every throw can be either a head or tail. It is a matter of chance that in one particular throw we get either of these.
The measure of the chance is the probability of an event.
Probability of an Event = (Number of favourable outcomes/Total number of outcomes of the experiment),
where we suppose that all outcomes are alike.
The probability of events P(E) that may occur can lie between 0 and 1. I.e., 0 ≤ P(E) ≤ 1.
An event which is sure to happen is called a sure event. Therefore, P (sure event) = 1.
An event that never happens is called an impossible event. Therefore, P(impossible event) = 0.
Overview of Deleted Syllabus for CBSE Class 8 Maths Data Handling
Class 8 Maths Chapter 4: Exercises Breakdown
Conclusion
NCERT Solutions for Class 8 Maths Data Handling involves organizing, interpreting, and analyzing data using various graphical representations like bar graphs, pie charts and histograms. It's crucial to focus on understanding the different types of data and choosing the appropriate graph to represent it accurately. Important aspects include learning to read and interpret graphs, calculating measures of central tendency (like mean, median, and mode), and understanding how to draw conclusions from data.In previous year question papers, there were typically around 3-4 questions related to data handling. These questions may involve interpreting given data, constructing graphs, calculating measures of central tendency, or solving word problems based on the data provided.
Other Study Material for CBSE Class 8 Maths Chapter 4
Chapter-Specific NCERT Solutions for Class 8 Maths
Given below are the chapter-wise NCERT Solutions for Class 8 Maths. Go through these chapter-wise solutions to be thoroughly familiar with the concepts.
Important Related Links for CBSE Class 8 Maths

FAQs on NCERT Solutions For Class 8 Maths Chapter 4 Data Handling - 2025-26
1. How are NCERT Solutions for Class 8 Maths Chapter 4 structured as per CBSE guidelines?
NCERT Solutions for Class 8 Maths Chapter 4 Data Handling follow a step-by-step problem-solving approach with detailed explanations as per CBSE 2025–26 requirements. Each question in the textbook is solved with logical steps, using official methods for graph construction, measure calculation (mean, median, mode), and probability. Every solution ensures clarity, correct reasoning, and matches marks allocation per CBSE standards.
2. What is the correct method to solve bar graph questions in NCERT Solutions for Class 8 Maths Chapter 4?
To solve bar graph questions in Chapter 4 Data Handling, you should:
- Read what the axes represent (categories vs. frequency/values)
- Use correct units and spacing between bars
- Label bars and both axes clearly
- Interpret heights to answer related questions
- Always reference the data range and frequency before making conclusions
3. How do NCERT Solutions for Class 8 Maths Chapter 4 explain probability with class-appropriate examples?
The solutions use examples like tossing coins, drawing slips, spinning wheels, and explain probability as Probability = (Number of favourable outcomes) / (Total number of outcomes). All probabilities are shown to lie between 0 and 1, with each experiment explained using everyday objects to make abstract concepts relatable.
4. What are the main types of graphical representation taught in Chapter 4 Data Handling?
Chapter 4 focuses on bar graphs (single and double), histograms (for grouped data), and pie charts (circle graphs). NCERT Solutions guide students stepwise on how to construct, label, and interpret each type, following CBSE methodology for accurate representation and analysis.
5. How do NCERT Solutions help students to avoid common mistakes in Data Handling problems?
Solutions highlight mistakes such as incorrectly grouping data, mislabeling axes, confusion between raw and organised data, and miscalculating central angles or probabilities. Each answer includes tips or warning notes, ensuring students understand requirements and avoid errors that lead to mark loss in exams.
6. What approach should be used for solving mean, median, and mode questions in the exercises for Chapter 4?
The method includes:
- Mean: Add all observations, divide by the total number
- Median: Arrange in ascending order, find central value(s)
- Mode: Identify the value with highest frequency
7. In Chapter 4, how does one differentiate between raw data and organized data as per NCERT Solutions?
Raw data refers to unorganized information as collected; organized data means arranging data into tables, groups, or using tally marks, enabling analysis. NCERT Solutions teach systematic arrangement, as required before graphical representation or calculation.
8. Why is it necessary to convert primary data to a more organised form before drawing graphs, as discussed in Class 8 Maths Chapter 4?
Converting primary (raw) data to an organised form (tables, grouped data) makes it possible to accurately represent information with graphs. This step reduces errors, helps in identifying patterns, and ensures that subsequent interpretation and calculation are meaningful, as explained in CBSE NCERT solutions.
9. What key skills do students develop by practising NCERT Solutions for Class 8 Maths Chapter 4 Data Handling?
By practising these solutions, students learn to:
- Collect and organise data systematically
- Draw and interpret various graphs
- Calculate central tendency (mean, median, mode)
- Understand and apply probability in daily scenarios
- Draw logical conclusions from statistical data
10. How do NCERT Solutions for Data Handling ensure students prepare for CBSE board exams effectively?
The NCERT Solutions are structured as per the CBSE 2025–26 syllabus and pattern. They include model answers, alternative approaches where needed, and solved examples similar to those in previous board exams. This familiarity with question types and solution methods helps maximize student confidence and performance in the exam.
11. What is the difference between a bar graph and a histogram according to Class 8 Data Handling NCERT Solutions?
A bar graph represents categorical data using bars with gaps in between, while a histogram displays grouped numerical data with no gaps, showing class intervals on the horizontal axis and frequency on the vertical. NCERT Solutions explain when to use each and how to construct them properly.
12. How do students verify if their calculated central angles for a pie chart are correct, as per NCERT guidelines?
NCERT Solutions recommend:
- Calculate each sector's central angle using the formula: (Value of item / Total value) × 360°
- Add all calculated angles—they should sum to exactly 360°
- Check for calculation slips before drawing
13. What are some higher-order thinking questions (HOTS) students may encounter in NCERT Solutions for Data Handling?
HOTS may include:
- Comparing data sets to spot trends or anomalies
- Explaining why a particular graph (e.g., histogram vs. pie chart) best represents data
- Predicting outcomes if data is grouped differently
- Analysing the impact of misrepresenting scales on interpretation
14. In what ways can central tendency (mean, median, mode) mislead data interpretation, and how do NCERT Solutions address this?
Solutions caution that:
- Mean can be affected by outliers/extreme values
- Mode may not represent the dataset if multiple modes/small data
- Median doesn't reflect actual data values in all cases
15. What should students focus on while solving probability questions in Class 8 Maths Chapter 4 NCERT Solutions for maximum accuracy?
Key points include:
- Correctly identifying total possible outcomes
- Listing all favourable outcomes distinctly
- Writing probability as a simplified fraction between 0 and 1
- Making no assumptions unless justified by data