Theory of Consumer Behaviour Class 12 NCERT Solutions with Free PDF
FAQs on NCERT Solutions For Class 12 Economics Chapter 2 Theory Of Consumer Behaviour (2025-26)
1. How do you determine a consumer's total income if the quantities of two goods purchased and their respective prices are provided in an NCERT problem?
To find the consumer's income (M), you use the budget line equation. The correct method is to multiply the quantity of each good by its price and sum the results. The formula is: M = (P₁ × Q₁) + (P₂ × Q₂), where P₁ and Q₁ are the price and quantity of the first good, and P₂ and Q₂ are for the second good. For instance, if a consumer buys 6 units of Good 1 at Rs 6 each and 8 units of Good 2 at Rs 8 each, the income is (6 × 6) + (8 × 8) = 36 + 64 = Rs 100.
2. What is the step-by-step method to formulate a budget line equation and find the maximum quantity of goods a consumer can buy with their entire income?
Following the CBSE 2025-26 syllabus, the steps are as follows:
- Step 1: Identify the income (M) and prices of the two goods (P₁ and P₂).
- Step 2: Write the budget line equation: P₁x₁ + P₂x₂ = M.
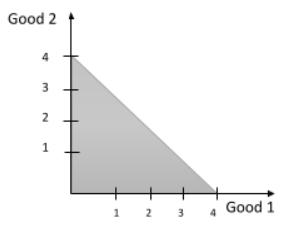
- Step 3: To find the maximum quantity of Good 1 (x₁), assume consumption of Good 2 (x₂) is zero. Solve for x₁: x₁ = M / P₁.
- Step 4: To find the maximum quantity of Good 2 (x₂), assume consumption of Good 1 (x₁) is zero. Solve for x₂: x₂ = M / P₂.
3. Why is the budget line always downward sloping in NCERT solutions? What does its slope represent?
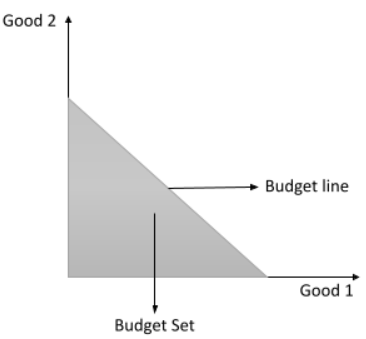
The budget line is downward sloping because a consumer has a fixed income. To increase the consumption of one good, they must decrease the consumption of the other. This inverse relationship results in a negative slope. The slope of the budget line is calculated as -P₁/P₂ (the negative ratio of the price of Good 1 to the price of Good 2). It represents the market rate of exchange—the rate at which the market allows the consumer to substitute one good for another.
4. How do you correctly show the effect on the budget line in a graph when a consumer's income increases, but prices remain the same?
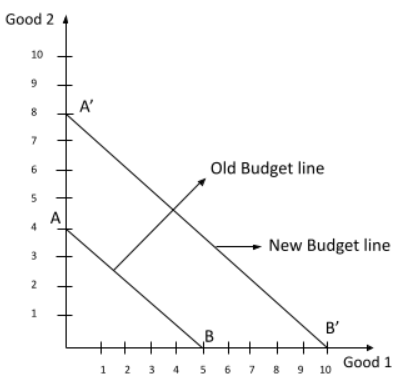
When a consumer's income increases and prices are constant, their purchasing power for both goods rises. The correct method to show this is a parallel outward shift of the budget line. The slope (-P₁/P₂) remains unchanged because the price ratio is constant. However, the new budget line will be further from the origin, indicating that the consumer can now afford more of both goods. The horizontal and vertical intercepts will both increase.
5. What is the correct method to illustrate the change in a budget line if the price of only one good decreases while income and the other price are unchanged?
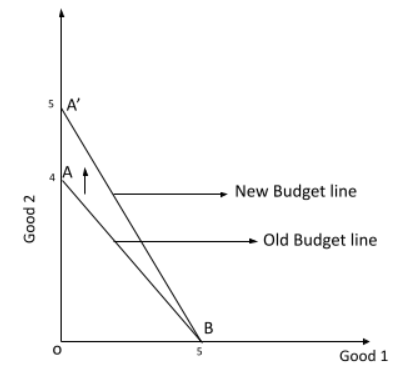
If the price of one good (say, Good 2 on the Y-axis) decreases, the budget line will pivot outwards from the intercept of the other good (Good 1 on the X-axis). The horizontal intercept (M/P₁) remains the same, as the price of Good 1 hasn't changed. The vertical intercept (M/P₂) increases, as the consumer can now buy more of Good 2 with the same income. This makes the new budget line steeper or flatter, depending on which good's price changed.
6. What happens to the consumer's budget set if both the prices of the goods and the consumer's income are doubled?
If both prices (P₁ and P₂) and the income (M) are doubled, the budget line does not change. Let the new income be 2M and new prices be 2P₁ and 2P₂. The new horizontal intercept is 2M / 2P₁ = M/P₁, and the new vertical intercept is 2M / 2P₂ = M/P₂. The slope is -(2P₁/2P₂) = -P₁/P₂. Since the intercepts and the slope remain identical to the original, the budget line and the budget set are completely unaffected.
7. How do you solve a problem that asks to derive the market demand function from individual demand functions?
To derive the market demand function, you must perform a horizontal summation of the individual demand functions. The key is to consider different price ranges where different consumers are active in the market.
- Step 1: Identify the price thresholds for each consumer (the price at which their demand becomes zero).
- Step 2: For each price range, sum the quantities demanded by all consumers who are willing to buy at that price.
- Step 3: Combine these into a single market demand function with different equations for different price ranges. For example, if D₁(p) is active for p ≤ 20 and D₂(p) is active for p ≤ 15, the market demand is D₁ + D₂ for p ≤ 15, and only D₁ for 15 < p ≤ 20.
8. What is the correct procedure to calculate the price elasticity of demand using the percentage method as given in the NCERT textbook?
The price elasticity of demand (e_d) measures the responsiveness of quantity demanded to a change in price. The correct procedure using the percentage method is: e_d = (% Change in Quantity Demanded) / (% Change in Price). Alternatively, you can use the formula: e_d = (ΔQ / ΔP) × (P / Q), where ΔQ is the change in quantity, ΔP is the change in price, P is the initial price, and Q is the initial quantity. The result is typically negative, reflecting the law of demand.
9. If an NCERT problem states the price elasticity of demand for a good is –0.2, how do you calculate the percentage fall in demand for a 10% price increase?
To solve this, use the formula for price elasticity of demand: e_d = (% Change in Quantity Demanded) / (% Change in Price).
Here, e_d = -0.2 and the % Change in Price = +10%.
Substitute the values: -0.2 = (% Change in Quantity Demanded) / 10%.
Now, solve for the unknown: % Change in Quantity Demanded = -0.2 × 10% = -2%.
Therefore, the demand for the good will go down by 2%.
10. In solving problems from Chapter 2, why is it crucial to distinguish between 'substitute' and 'complementary' goods?
Distinguishing between these goods is vital because it determines how the demand for one good shifts when the price of another good changes. For substitute goods (e.g., tea and coffee), an increase in the price of one leads to an increase in demand for the other. For complementary goods (e.g., cars and petrol), an increase in the price of one leads to a decrease in demand for the other. Misidentifying this relationship will lead to incorrect conclusions about shifts in the demand curve in problem-solving.
11. How do you identify whether a good is 'normal' or 'inferior' based on information given in a problem?
You can identify the type of good by examining the relationship between a consumer's income and their demand for it.
- A good is a normal good if its demand increases when the consumer's income rises. There is a positive relationship between income and demand.
- A good is an inferior good if its demand decreases when the consumer's income rises. There is an inverse relationship.
12. How can one determine if a consumer's preferences are monotonic when comparing two different bundles of goods?
A consumer's preferences are monotonic if they always prefer a bundle that contains more of at least one good and no less of the other. To solve this, compare two bundles, say Bundle A (10, 8) and Bundle B (10, 6). Since Bundle A contains the same amount of the first good (10) and more of the second good (8 vs. 6), a consumer with monotonic preferences must prefer Bundle A. If they are indifferent between them, their preferences are not monotonic.


