


Maths Notes for Chapter 13 Statistics Class 10 - FREE PDF Download
Revision plays a crucial role in understanding the concepts and securing good grades in the board exams. To have a revision, it is important to have revision notes of each chapter especially in subjects like Mathematics, as it contains different formulas and facts. To ease your preparation, we at Vedantu are presenting Class 10 Maths Chapter 13 notes on this page in PDF format. Class 10 Maths Statistics notes provided by Vedantu includes all facts and formulas that are important for the students to solve the question given in the chapter quickly and conveniently.
 Table of Content
Vedantu also provides NCERT Solution and other study materials for students. You can also download NCERT Solution Class 10 Science to score more marks in the examinations.
CBSE Notes Class 10 Maths Chapter 13 - Statistics - 2026-27
Statistics
Statistics is the study of the collection, analysis, interpretation, presentation, and organization of data. In other words, it is a mathematical discipline to collect and summarize data.
Mean of grouped data
Mean is a measure of central tendency and is defined as an average value of given observations.
There are three methods to find mean of grouped data:
Direct Method:
\[\overline x \; = \;\dfrac{{\sum\limits_{i = 1}^n {{f_i}{x_i}} }}{{\sum\limits_{i = 1}^n {{f_i}} }}\]
Where \[\overline x \] is mean, \[f\] is frequency and \[x\] is the mid-interval
Assumed Mean Method:
\[\overline x \; = \;A\; + \;\dfrac{{\sum\limits_{i = 1}^n {{f_i}{d_i}} }}{{\sum\limits_{i = 1}^n {{f_i}} }}\]
Here, \[A\] is called assumed mean and \[d\; = \;x\; - \;A\]
Step Deviation method:
\[\overline x \; = \;A\; + \;h\; \times \;\dfrac{{\sum\limits_{i = 1}^n {{f_i}{t_i}} }}{{\sum\limits_{i = 1}^n {{f_i}} }}\]
Here, h is called class size and \[t\; = \;\dfrac{d}{h}\]
Mode of Grouped Data:
It is the observation having the highest value of frequency among all observations.
In case of grouped data, firstly modal class is located and then following formula is used to calculate mode:
\[Mode\; = \;l\; + \;\left( {\dfrac{{{f_1}\; - \;{f_0}}}{{2{f_1}\; - \;{f_0}\; - \;{f_2}}}} \right)\; \times \;h\]
\[\;l\]is lower limit of modal class.
\[h\] is upper limit of modal class.
\[{f_1}\] is frequency of the modal class.
\[{f_0}\] is frequency of the class preceding the modal class.
\[f\] is frequency of the class succeeding the modal class.
Median of Grouped Data:
It is the value of the middlemost observation of the data.
For grouped data, following formula is used to find median of the data but first we find the median class, then apply formula:
\[Median\; = \;l\; + \;\left( {\dfrac{{\dfrac{N}{2}\; - \;c}}{f}} \right)\; \times \;h\]
\[l\] is Lower limit of the median class
\[f\] is Cumulative frequency preceding the median class frequency
\[N\] is Sum of the frequencies
\[h\] is Width of the class interval
Working Rule:
Step 1: Prepare the table of less than the cumulative frequency using the frequency table given in the question.
Step 2: Find out the cumulative frequency corresponding to the value of \[\dfrac{N}{2}\]. A median class interval is defined as a class interval corresponding to this cumulative frequency.
Step 3: Find the value of lower limit l and frequency f of the median class.
Step 4: Find the width 'h' of the median class interval.
Step 5: Find value of ‘c’, the cumulative frequency of preceding median class
Step 6: Apply the formula written above.
Graphs in Statistics:
Graphical Representation of Cumulative Frequency Distribution
We find Cumulative frequency by adding the frequencies of the preceding intervals up to that class interval and the frequency of a class interval.
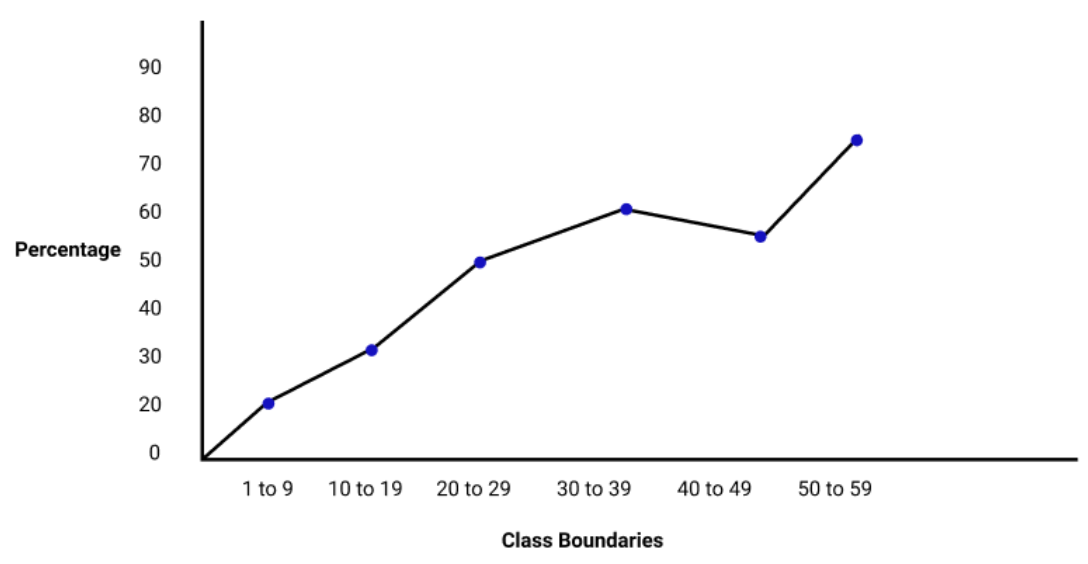
Ogive (Cumulative Frequency Curve)
There are two ways of constructing an Ogive or cumulative frequency curve.
Less than type Ogive: It is represented by a rising curve.
More than type Ogive: It is represented by a falling curve.
Ogive is pronounced as O-jive and This curve is ‘S-shaped.
To Plot an Ogive:
We plot the actual limits along the x-axis and the cumulative frequencies along the y-axis. Plot corresponding coordinates of each class interval.
Join the plotted points with a rough hand.
Connect an Ogive to a point on the X-axis which represents the actual lower limit of the first class.
Revision Notes Class 10 Maths Chapter 13: Introduction to Statistics
Class 10 Chapter 13 Maths notes are prepared by the subject experience teachers at Vedantu. It includes all statistical concepts like grouped data, ungrouped data, measures of central tendency like mean, median, mode, methods to find mean, median, and mode, and the relationship between them, along with the important facts and formulae that are important to have a proper understanding of the chapter.
To have a quick overview of the important concepts of the chapter before the exams, download Class 10 Chapter 13 Maths notes free PDF through the link given here.
A Quick Overview of Class 10 Maths Chapter 13
In Class 10 Maths Chapter 13, students will learn the three measures of central tendency that are mean, median, and mode from ungrouped data to that of grouped data. Students will also understand the concepts of cumulative frequency, the cumulative frequency distribution, and how to draw cumulative frequency known as ogives.
Mean of Grouped Data
The mean of the observation is the sum of all the values given in the observations divided by the total number of observations.
If y₁,y₂, y₃, y₄...yₙ are observation with respective frequencies f1, f2, f3, f4, ….,fn
Then, the mean of the yof the data is given by:
\[\bar{y}\] = \[\frac{f_{1}y_{1}, f_{2}y_{2}, f_{3}y_{3}, f_{4}y_{4},+.....+y_{n}}{f_{1}, f_{2}, f_{3}, f_{4},....f_{n} }\]
Mode of Grouped Data
The mode of the is that value among the observations which occurs most frequently and is also defined as the value of the observation having a maximum frequency.
Median of Grouped Data
Median is defined as the measure of central tendency which obtains the value of the middlemost observation in the data.
If n is odd, then the median is the \[\left ( \frac{n+1}{2} \right )^{th}\]term of the observations.
If n is even, then the median is defined as the average of the \[\left ( \frac{n}{2} \right )^{th}\] and the \[\left ( \frac{n+1}{2} \right )^{th}\] term of the observations.
Cumulative Frequency
The cumulative frequency of the class is the frequency that is received by adding the frequencies of all the classes above the given class.
List of the Topics and Subtopics Covered in Class 12 Maths Chapter 13
13.1: Introduction
13.2: Mean of Grouped Data
13.3: Mode of Grouped Data
13.4: Median of Grouped Data
13.5: Graphical Representation of Cumulative Frequency Distribution
To have a detailed understanding of all the above topics discussed above, download Class 10 Maths Statistics Notes free PDF now.
Benefits of Class 10 Maths Chapter Statistics Notes
Here are some of the benefits of referring to Class 10 Maths Chapter Statistics notes:
The Class 10 Maths Chapter Statistics notes are 100% accurate as the notes are prepared by the experts after having extensive research of the topics.
The Class 10 Maths Statistics notes are available in a PDF format that helps students to revise the notes anytime and at any place as per their comfort.
The Class 10 Maths Chapter 13 notes enable students to recall all the previously learned concepts of the chapter quickly and conveniently especially during the exams when they have to revise the whole syllabus in a limited period.
Class 10 Maths Statistics notes enable students to get acquainted with the topics and also helps to identify the key elements of the chapter
Class 10 Maths Chapter 13 notes curbs the activities of referring to the multiple study material for preparing the chapter during revision.
Solved Examples
1. The daily expenditure on food for 25 households in a locality is depicted in the table given below. Determine the mean of daily expenditure on food using an appropriate method.
Solution:
Determine the mid-point of the given interval using the formula.
Midpoint (xi) = (upper limit + lower limit)/2
Let the mean (A) be equal to 225.
Class size (h) = 50
Mean = Σ fi.xi / Σ fi
= 5275 / 25 = 211
Hence, the mean of daily expenditure on food comes out to be 211.
2. Information on the observed lifetimes (in hours) of 225 electrical components is given in the following data. Calculate the modal lifetimes of the components.
Solution:
Based on the given data, the modal class is 60–80 as the frequency of this interval is maximum..
So, lower limit of modal class l = 60,
The frequencies are as follows:
fm = 61, f1 = 52, f2 = 38 and h = 20
Mode = l+ [(fm-f1)/(2fm-f1-f2)]×h
Substituting the values in the formula, we obtain
Mode =60+[(61-52)/(122-52-38)]×20
Mode = 60+((9 x 20)/32)
Mode = 60+(45/8) = 60+ 5.625
Hence, the modal lifetime of the components is computed to be 65.625 hours.
What are the Benefits of Referring to Vedantu’s Revision Notes for Class 10 Maths Chapter 13 - Statistics
Provides quick, clear summaries of key concepts.
Simplifies complex topics for better understanding.
Efficient tool for last-minute exam prep.
Enhances retention of crucial information.
Supports effective exam preparation with key points and tips.
Saves time by consolidating information.
Prioritizes important topics and questions.
Offers practical examples for real-world connections.
Boosts student confidence for exams.
Conclusion
Statistics is one of the most important and easy to understand the chapter in the CBSE Class 10 Maths syllabus. Learning statistics will enable students to properly collect and use data, make accurate analyses, and prepare a great presentation of results. Solved examples and revision notes help students achieve desired results in their exams in terms of scoring and we take pride in improving the conceptualisation of topics in students. We advise students to go through these revision notes along with the other related links that have been provided in this article so that they can make full use of the materials provided by Vedantu.
Related Study Materials for Class 10 Maths Chapter 13 Statistics
Chapter-wise Links for Mathematics Class 10 Notes
Related Important Links for Mathematics Class 10
Along with this, students can also download additional study materials provided by Vedantu for Maths Class 10–


FAQs on CBSE Notes Class 10 Maths Chapter 13 - Statistics - 2026-27
1. What are the key concepts covered in the Class 10 Maths Chapter 13 Statistics revision notes as per the latest CBSE syllabus?
The revision notes for Class 10 Statistics include core topics such as types of data (grouped and ungrouped), measures of central tendency (mean, median, mode), methods to calculate mean (Direct, Assumed Mean, Step Deviation), modal class and its formula, median for grouped data, graphical representations like cumulative frequency curves (ogives), and essential formulas and solved examples. The notes are aligned with the CBSE 2026–27 syllabus.
2. How does the concept map for Statistics Class 10 help in quick revision before exams?
A well-structured concept map links all major and minor topics of Chapter 13 in a visual manner. It helps students quickly recall definitions, formulas, and relationships (like the link between mean, median, mode) and understand the flow from data collection to analysis and representation. This aids in last-minute revision and strengthens inter-topic connections to improve retention and exam performance.
3. What is the recommended order for revising Statistics in Class 10 using summary notes?
The most effective revision sequence for Statistics Class 10 Notes is:
- Start with basic terms and types of data.
- Move to construction of frequency tables.
- Review measures of central tendency: mean (and its methods), median, and mode.
- Understand formulas and learn their stepwise applications with examples.
- Revise graphical representations such as ogive curves.
- Finally, focus on the summary of key formulas and common errors.
4. Which formulas should be prioritised during last-minute revision for Statistics Class 10?
The most important formulas for Class 10 Statistics revision are:
- Mean (Direct, Assumed Mean, Step Deviation Methods): Formulas for all approaches.
- Mode (Grouped Data): Mode = l + [(f1 – f0)/(2f1 – f0 – f2)] × h
- Median (Grouped Data): Median = l + [(N/2 – c)/f] × h
- Cumulative Frequency and Ogive plotting rules
5. How do the revision notes summarise the steps involved in solving questions on measures of central tendency?
The revision notes break down every measure of central tendency into clear steps:
- Identify whether the data is grouped or ungrouped.
- Select the correct formula or method needed (Direct, Assumed Mean, Step Deviation).
- Substitute the appropriate frequency and mid-value/class limit values.
- Solve stepwise and cross-check calculations to avoid errors.
- Summarise the solution using final units or class intervals where appropriate.
6. What are some common misconceptions students have while revising Statistics in Class 10, and how can they be avoided?
Frequent misconceptions include confusing the application of mean formulas for grouped vs. ungrouped data, misidentifying modal class, and calculation errors in cumulative frequency. To avoid them:
- Always check the data type before choosing a formula.
- Carefully identify class intervals and frequencies for mode and median.
- Practice with multiple solved examples from revision notes.
- Use the concept map to remember relationships and logic, not just formulas.
7. Why is structured revision using summary notes beneficial for mastering Statistics Class 10?
Structured revision with concise notes allows students to focus on key formulas, definitions, and solving methods efficiently. It prevents information overload, enables better retention of core ideas, and improves performance in both objective and application-based questions during the CBSE Class 10 board exams.
8. How can students use solved examples in revision notes to reinforce their understanding of Statistics concepts?
Solved examples in revision notes show the step-by-step application of formulas and methods, clarify how to organise data, and demonstrate proper calculation techniques. By practicing these, students gain confidence, learn to avoid common mistakes, and understand marking schemes for different question types.
9. What is the role of graphical representation in Statistics, and how should students revise this portion?
Graphical representation, especially the ogive, is essential for visualising cumulative frequency distribution. To revise:
- Understand the difference between 'less than' and 'more than' ogive.
- Practice plotting cumulative frequencies against class boundaries.
- Review the interpretation of curves for finding median visually.
10. How do revision notes for Chapter 13 help improve exam performance in CBSE Class 10 Mathematics?
Revision notes present content in a summarised, easy-to-read format. They highlight all important formulas, steps, and shortcuts, reduce the need to consult multiple sources, and enable quick recap during last-minute exam preparation. This boosts both accuracy and speed when answering Statistics questions in the board exam.