


NCERT Solutions For Class 9 Maths Chapter 14 Statistics in Hindi - 2025-26
NCERT Solutions For Class 9 Maths in Hindi Chapter 14 Statistics (2025-26)
प्रश्नावली 14.2
प्रश्न 1. आठवीं कक्षा के 30 विद्यार्थियों के रक्त समूह ये हैं:
\[\mathbf{A},\text{ }\mathbf{B},\text{ }\mathbf{O},\text{ }\mathbf{O},\text{ }\mathbf{AB},\text{ }\mathbf{O},\text{ }\mathbf{A},\text{ }\mathbf{O},\text{ }\mathbf{B},\text{ }\mathbf{A},\text{ }\mathbf{O},\text{ }\mathbf{B},\text{ }\mathbf{A},\text{ }\mathbf{O},\text{ }\mathbf{O},\text{ }\mathbf{A},\text{ }\mathbf{AB},\text{ }\mathbf{O},\text{ }\mathbf{A},\text{ }\mathbf{A},\text{ }\mathbf{O},\text{ }\mathbf{O},\text{ }\mathbf{AB},\text{ }\mathbf{B},\text{ }\mathbf{A},\text{ }\mathbf{O},\text{ }\mathbf{B},\text{ }\mathbf{A},\text{ }\mathbf{B},\text{ }\mathbf{O}.\]इन आँकड़ों को एक बारंबारता बंटन सारणी के रूप में प्रस्तुत कीजिए। बताइए कि इन विद्यार्थियों में कौन सा रक्त समूह अधिक सामान्य है और कौन सा रक्त समूह विरलतम रक्त समूह है।
उत्तर:
सबसे अधिक सामान्य समूह \[=O\]
सबसे विरल समूह \[=AB\]
प्रश्न 2. \[\mathbf{40}\]इंजीनियरों की उनके आवास से कार्य स्थल की (किलोमीटर में) दूरियाँ ये हैं:
\[5\text{ }3\text{ }10\text{ }20\text{ }25\text{ }11\text{ }13\text{ }7\text{ }12\text{ }31\text{ }19\text{ }10\text{ }12\text{ }17\text{ }18\text{ }11\text{ }32\text{ }17\text{ }16\text{ }2\text{ }7\text{ }9\text{ }7\text{ }8\text{ }3\text{ }5\text{ }12\text{ }15\text{ }18\text{ }3\text{ }12\text{ }14\text{ }2\text{ }9\text{ }6\text{ }15\text{ }15\text{ }7\text{ }6\text{ }12\] \[0-5\]को (जिसमें \[5\] सम्मिलित नहीं है) पहला अंतराल लेकर ऊपर दिए हुए आँकड़ों से वर्ग माप \[5\] वाली एक वर्गीकृत बारंबारता बंटन सारणी बनाइए। इस सारणी बद्ध निरूपण में आपको कौन से मुख्य लक्षण देखने को मिलते हैं?
उत्तर-
अधिकतर इंजीनियर \[20\] किमी से कम दूरी पर रहते हैं।
बहुत कम इंजीनियर \[20\] किमी से अधिक दूरी पर रहते हैं।
प्रश्न 3. 30 दिन वाले महीने में एक नगर की सापेक्ष आर्द्रता (%में) यह रही है:
\[\begin{align} & \mathbf{98}.\mathbf{1}\text{ }\mathbf{98}.\mathbf{6}\text{ }\mathbf{99}.\mathbf{2}\text{ }\mathbf{90}.\mathbf{3}\text{ }\mathbf{86}.\mathbf{5}\text{ }\mathbf{95}.\mathbf{3}\text{ } \\ & \mathbf{92}.\mathbf{9}\text{ }\mathbf{96}.\mathbf{3}\text{ }\mathbf{94}.\mathbf{2}\text{ }\mathbf{95}.\mathbf{1}\text{ }\mathbf{89}.\mathbf{2} \\ & \mathbf{92}.\mathbf{3}\text{ }\mathbf{97}.\mathbf{1}\text{ }\mathbf{93}.\mathbf{5}\text{ }\mathbf{92}.\mathbf{7}\text{ }\mathbf{95}.\mathbf{1}\text{ }\mathbf{97}.\mathbf{2}\text{ }\mathbf{93}.\mathbf{3}\text{ }\mathbf{95}.\mathbf{2}\text{ }\mathbf{97}.\mathbf{3}\text{ }\mathbf{96}.\mathbf{2}\text{ }\mathbf{92}.\mathbf{1}\text{ }\mathbf{84}.\mathbf{9}\text{ }\mathbf{90}.\mathbf{2}\text{ } \\ & \mathbf{95}.\mathbf{7}\text{ }\mathbf{98}.\mathbf{3}\text{ }\mathbf{97}.\mathbf{3}\text{ }\mathbf{96}.\mathbf{1}\text{ }\mathbf{92}.\mathbf{1}\text{ }\mathbf{89} \\ \end{align}\]
वर्ग 84-86, 86-88 आदि लेकर एक वर्गीकृत बारंबारता बंटन बनाइए।
उत्तर:
क्या आप बता सकते हैं कि ये आँकड़े किस महीने या ऋतु से संबंधित हैं?
उत्तर: वर्षा ऋतु
इन आँकड़ों का परिसर क्या है?
उत्तर: आँकड़े का परिसर \[=99.2\text{ }\text{ }84.9\text{ }=\text{ }14.3\]
प्रश्न 4. निकटतम सेंटीमीटरों में मापी गई \[\mathbf{50}\] विद्यार्थियों की लंबाइयाँ ये हैं:
\[\begin{align} & 161\text{ }150\text{ }154\text{ }165\text{ }168\text{ }161\text{ }154\text{ }162\text{ }150\text{ } \\ & 151\text{ }162\text{ }164\text{ }171\text{ }165\text{ }158\text{ }154\text{ }156\text{ }172\text{ } \\ & 160\text{ }170\text{ }153\text{ }159\text{ }161\text{ }170\text{ }162\text{ }165\text{ }166\text{ } \\ & 168\text{ }165\text{ }164\text{ }154\text{ }152\text{ }153\text{ }156\text{ }158\text{ }162\text{ } \\ & 160\text{ }161\text{ }173\text{ }166\text{ }161\text{ }159\text{ }162\text{ }167\text{ }168\text{ } \\ & 159\text{ }158\text{ }153\text{ }154\text{ }159 \\ \end{align}\]
\[\mathbf{160}-\mathbf{165},\text{ }\mathbf{165}-\mathbf{170}\]आदि का वर्ग अंतराल लेकर ऊपर दिए गए आँकड़ों को एक वर्गीकृत बारंबारता बंटन सारणी के रूप में निरूपित कीजिए।
उत्तर:
इस सारणी की सहायता से आप विद्यार्थियों की लंबाइयों के संबंध में क्या निष्कर्ष निकाल सकते हैं?
उत्तर: अधिकतर छात्र \[160-170\]सेमी लंबे हैं, जबकि बहुत कम छात्र \[170\] सेमी से अधिक लंबे हैं।
प्रश्न 5. एक नगर में वायु में सल्फर डाई-ऑक्साइड का सांद्रण भाग प्रति मिलियन में ज्ञात करने के लिए अध्ययन किया गया। 30 दिनों में प्राप्त किए गए आँकड़े ये हैं
\[\begin{align} & \mathbf{0}.\mathbf{03}\text{ }\mathbf{0}.\mathbf{08}\text{ }\mathbf{0}.\mathbf{08}\text{ }\mathbf{0}.\mathbf{09}\text{ }\mathbf{0}.\mathbf{04}\text{ }\mathbf{0}.\mathbf{17}\text{ }\mathbf{0}.\mathbf{16}\text{ }\mathbf{0}.\mathbf{05}\text{ }\mathbf{0}.\mathbf{02}\text{ } \\ & \mathbf{0}.\mathbf{06}\text{ }\mathbf{0}.\mathbf{18}\text{ }\mathbf{0}.\mathbf{20}\text{ }\mathbf{0}.\mathbf{11}\text{ }\mathbf{0}.\mathbf{08}\text{ }\mathbf{0}.\mathbf{12}\text{ }\mathbf{0}.\mathbf{13}\text{ }\mathbf{0}.\mathbf{22}\text{ }\mathbf{0}.\mathbf{07}\text{ }\mathbf{0}.\mathbf{08}\text{ }\mathbf{0}.\mathbf{01}\text{ }\mathbf{0}.\mathbf{10}\text{ }\mathbf{0}.\mathbf{06}\text{ }\mathbf{0}.\mathbf{09}\text{ }\mathbf{0}.\mathbf{18}\text{ }\mathbf{0}.\mathbf{11}\text{ }\mathbf{0}.\mathbf{07}\text{ }\mathbf{0}.\mathbf{05}\text{ }\mathbf{0}.\mathbf{07}\text{ }\mathbf{0}.\mathbf{01}\text{ }\mathbf{0}.\mathbf{04} \\ \end{align}\]
\[\text{ }\mathbf{0}.\mathbf{00}-\mathbf{0}.\mathbf{04},\text{ }\mathbf{0}.\mathbf{04}-\mathbf{0}.\mathbf{08}\]आदि का वर्ग अंतराल लेकर इन आँकड़ों की एक वर्गीकृत बारंबारता आवंटन सारणी बनाइए।
उत्तर:
सल्फर डाईऑक्साइड की सांद्रता कितने दिन \[\mathbf{0}.\mathbf{11}\]भाग प्रति मिलियन से अधिक रही?
उत्तर: \[6\] दिन
प्रश्न 6. तीन सिक्कों को एक साथ 30 बार उछाला गया। प्रत्येक बार चित आने की संख्या निम्न है।
\[0\text{ }1\text{ }2\text{ }2\text{ }1\text{ }2\text{ }3\text{ }1\text{ }3\text{ }0\text{ }1\text{ }3\text{ }1\text{ }1\text{ }2\text{ }2\text{ }0\text{ }1\text{ }2\text{ }1\text{ }3\text{ }0\text{ }0\text{ }1\text{ }1\text{ }2\text{ }3\text{ }2\text{ }2\text{ }0\]
ऊपर दिये गए आकड़ों के लिए एक बारंबारता बंटन सारणी बनाइये ।
उत्तर:
प्रश्न 7. \[\mathbf{50}\]दशमलव स्थान तक शुद्ध \[\mathbf{\pi }\] का मान नीचे दिया गया है:
\[\mathbf{3}.\mathbf{14159265358979323846264338327950288419716939937510}\]
दशमलव बिंदु के बाद आने वाले \[\mathbf{0}\] से \[\mathbf{9}\] तक के अंकों का एक बारंबारता बंटन बनाइए।
उत्तर:
सबसे अधिक बार और सबसे कम बार आने वाले अंक कौन-कौन से हैं?
उत्तर: सबसे अधिक बार आने वाला अंक \[=3\] और \[9\]
सबसे कम बार आने वाला अंक \[=0\]
प्रश्न 8. तीस बच्चों से यह पूछा गया कि पिछले सप्ताह उन्होंने कितने घंटों तक टीवी के प्रोग्राम देखे। प्राप्त परिणाम ये रहे हैं:
\[\mathbf{1}\text{ }\mathbf{6}\text{ }\mathbf{2}\text{ }\mathbf{3}\text{ }\mathbf{5}\text{ }\mathbf{12}\text{ }\mathbf{5}\text{ }\mathbf{8}\text{ }\mathbf{4}\text{ }\mathbf{8}\text{ }\mathbf{10}\text{ }\mathbf{3}\text{ }\mathbf{4}\text{ }\mathbf{12}\text{ }\mathbf{2}\text{ }\mathbf{8}\text{ }\mathbf{15}\text{ }\mathbf{1}\text{ }\mathbf{17}\text{ }\mathbf{6}\text{ }\mathbf{3}\text{ }\mathbf{2}\text{ }\mathbf{8}\text{ }\mathbf{5}\text{ }\mathbf{9}\text{ }\mathbf{6}\text{ }\mathbf{8}\text{ }\mathbf{7}\text{ }\mathbf{14}\text{ }\mathbf{12}\]
वर्ग चौड़ाई \[\mathbf{5}\] लेकर और एक वर्ग अंतराल को \[\mathbf{5}-\mathbf{10}\]लेकर इन आँकड़ों की एक वर्गीकृत बारंबारता बंटन सारणी बनाइए।
उत्तर:
कितने बच्चों ने सप्ताह में 15 या अधिक घंटों तक टेलीविजन देखा?
उत्तर: \[2\] बच्चे
प्रश्न 9. एक कंपनी एक विशेष प्रकार की कार बैट्री बनाती है। इस प्रकार की 40 बैट्रियों के जीवन-काल (वर्षों में) ये रहे हैं?
\[\begin{align} & \mathbf{2}.\mathbf{6}\text{ }\mathbf{3}.\mathbf{0}\text{ }\mathbf{3}.\mathbf{7}\text{ }\mathbf{3}.\mathbf{2}\text{ }\mathbf{2}.\mathbf{2}\text{ }\mathbf{4}.\mathbf{1}\text{ }\mathbf{3}.\mathbf{5}\text{ }\mathbf{4}.\mathbf{5}\text{ }\mathbf{3}.\mathbf{5}\text{ }\mathbf{2}.\mathbf{3}\text{ }\mathbf{3}.\mathbf{2}\text{ }\mathbf{3}.\mathbf{4}\text{ }\mathbf{3}.\mathbf{8}\text{ }\mathbf{3}.\mathbf{2}\text{ }\mathbf{4}.\mathbf{6}\text{ }\mathbf{3}.\mathbf{7}\text{ }\mathbf{2}.\mathbf{5}\text{ } \\ & \mathbf{4}.\mathbf{4}\text{ }\mathbf{3}.\mathbf{4}\text{ }\mathbf{3}.\mathbf{3}\text{ }\mathbf{2}.\mathbf{9}\text{ }\mathbf{3}.\mathbf{0}\text{ }\mathbf{4}.\mathbf{3}\text{ }\mathbf{2}.\mathbf{8}\text{ }\mathbf{3}.\mathbf{5}\text{ }\mathbf{3}.\mathbf{2}\text{ }\mathbf{3}.\mathbf{9}\text{ }\mathbf{3}.\mathbf{2}\text{ }\mathbf{3}.\mathbf{2}\text{ }\mathbf{3}.\mathbf{1}\text{ }\mathbf{3}.\mathbf{7}\text{ }\mathbf{3}.\mathbf{4}\text{ }\mathbf{4}.\mathbf{6}\text{ }\mathbf{3}.\mathbf{8}\text{ } \\ & \mathbf{3}.\mathbf{2}\text{ }\mathbf{2}.\mathbf{6}\text{ }\mathbf{3}.\mathbf{5}\text{ }\mathbf{4}.\mathbf{2}\text{ }\mathbf{2}.\mathbf{9}\text{ }\mathbf{3}.\mathbf{6} \\ \end{align}\]
\[\mathbf{0}.\mathbf{5}\]माप के वर्ग अंतराल लेकर तथा अंतराल \[\mathbf{2}-\mathbf{2}.\mathbf{5}\]से प्रारंभ करके इन आँकड़ों की एक वर्गीकृत बारंबारता सारणी बनाइए।
उत्तर:
प्रशावली 14.3
प्रश्न 1. एक संगठन ने पूरे विश्व में \[\mathbf{15}-\mathbf{44}\] (वर्षों में) की आयु वाली महिलाओं में बीमारी और मृत्यु के कारणों का पता लगाने के लिए किए गए सर्वेक्षणों से निम्नलिखित आँकड़े (% में) प्राप्त किए
उत्तर:
ऊपर दी गई सूचनाओं को आलेखीय रूप में निरूपित किजिए।
उत्तर:
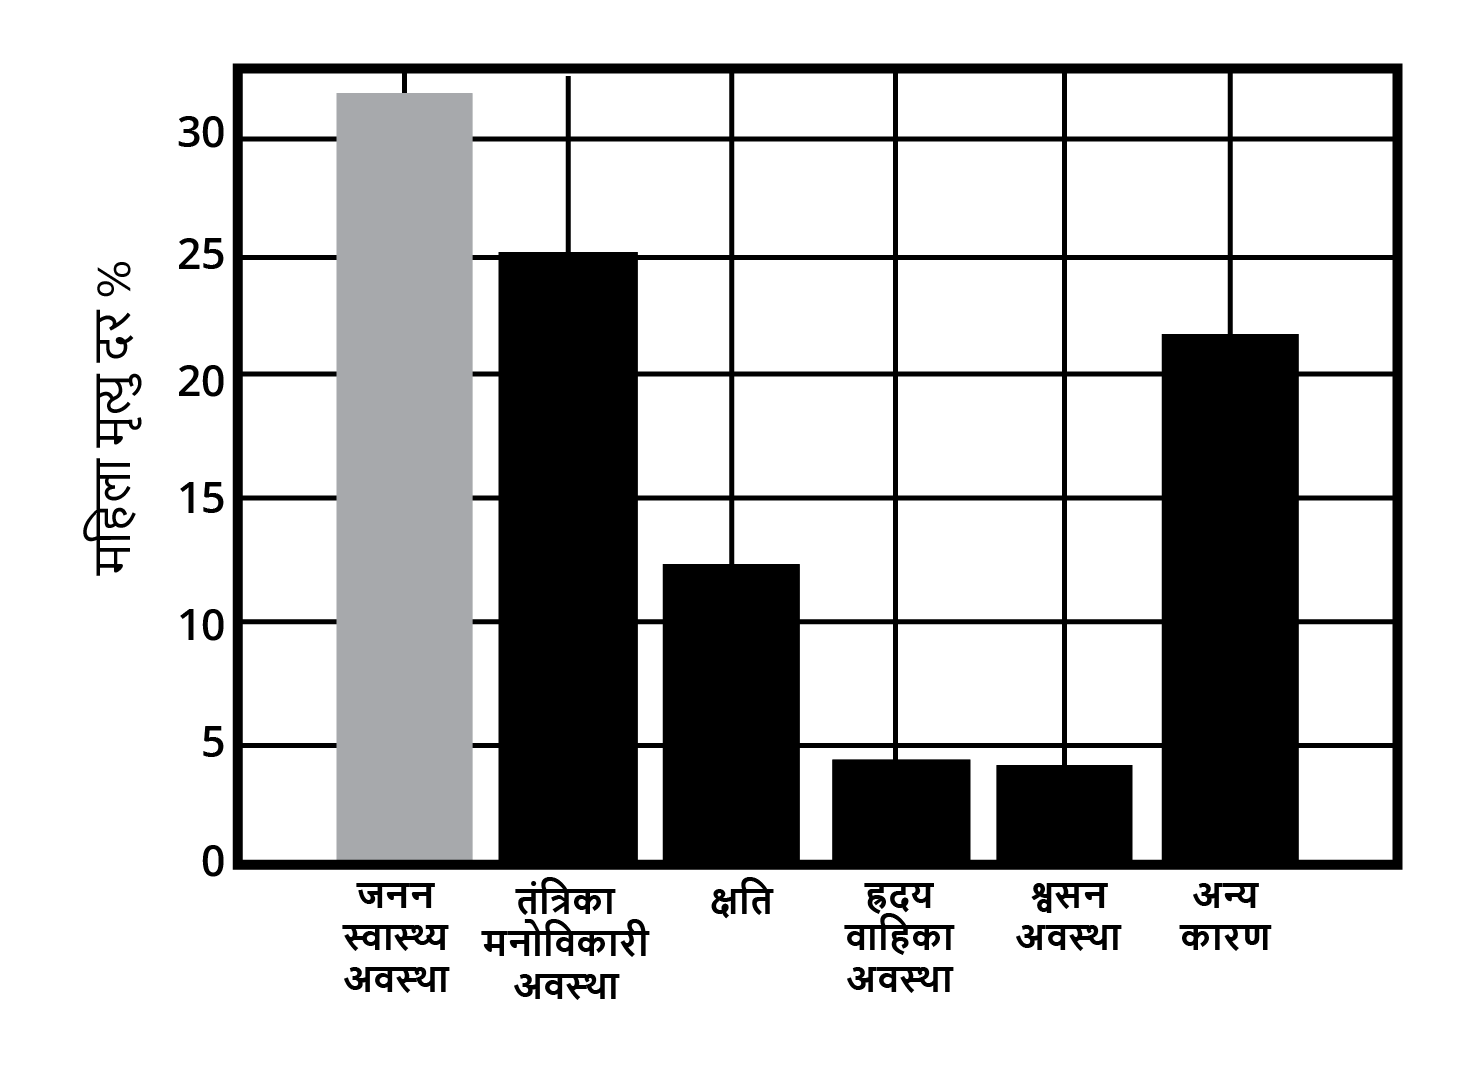
कौन सी अवस्था पूरे विश्व की मैलाओं के खराब स्वास्थ्य और मृत्यु का बड़ा कारण है?
उत्तर: जनन स्वास्थ्य अवस्था
अपनी अध्यापिका की सहायता से ऐसे दो कारणों का पता लगाने का प्रयास कीजिए जिनकी ऊपर (b) में मुख्य भूमिका रही हो।
उत्तर: अज्ञानता, स्वच्छता की कमी और स्वास्थ्य सुविधाओं की कमी
प्रश्न 2. भारतीय समाज के विभिन्न क्षेत्रों में प्रति हजार लड़कों पर लड़कियों की (निकटतम दस तक की) संख्या के आँकड़े नीचे दिए गए हैं।
ऊपर दी गई सूचनाओं को एक दंड आलेख द्वारा निरूपित कीजिए।
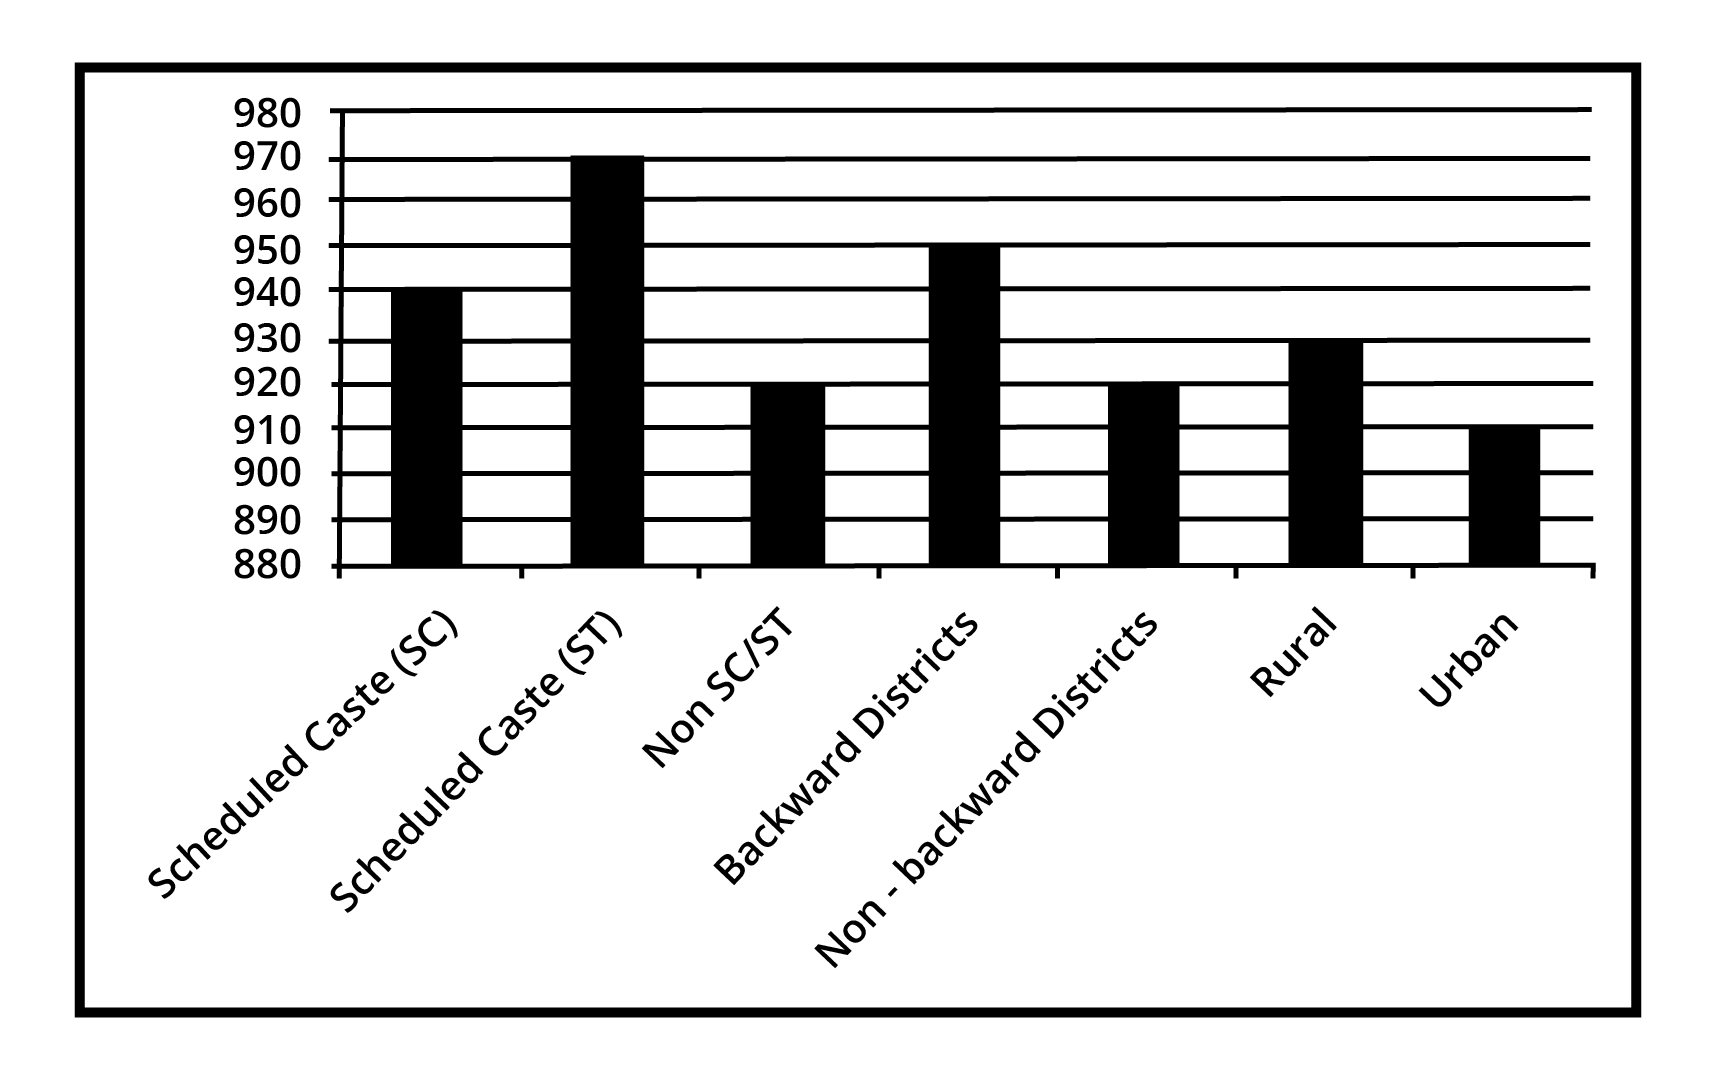
कक्षा में चर्चा करके, बताइए कि आप इस आलेख से कौन कौन से निषर्ष निकाल सकते हैं।
उत्तर: अनुसूचित जनजाति में लिंग अनुपात बेहतर है और लड़कियों के अनुकूल है
पिछड़े जिलों में लैंगिक अनुपात बेहतर है
उत्तर: शहरी क्षेत्रों की तुलना में ग्रामीण क्षेत्रों में लैंगिक अनुपात बेहतर है।
प्रश्न 3. एक राज्य के विधान सभा के चुनाव में विभिन्न राजनैतिक पार्टियों द्वारा जीती हुई सीटों के परिणाम नीचे दिए गए हैं।
मतदान के परिणामों को निरुपित करने वाला एक दंड आलेख खींचिए।
उत्तर:
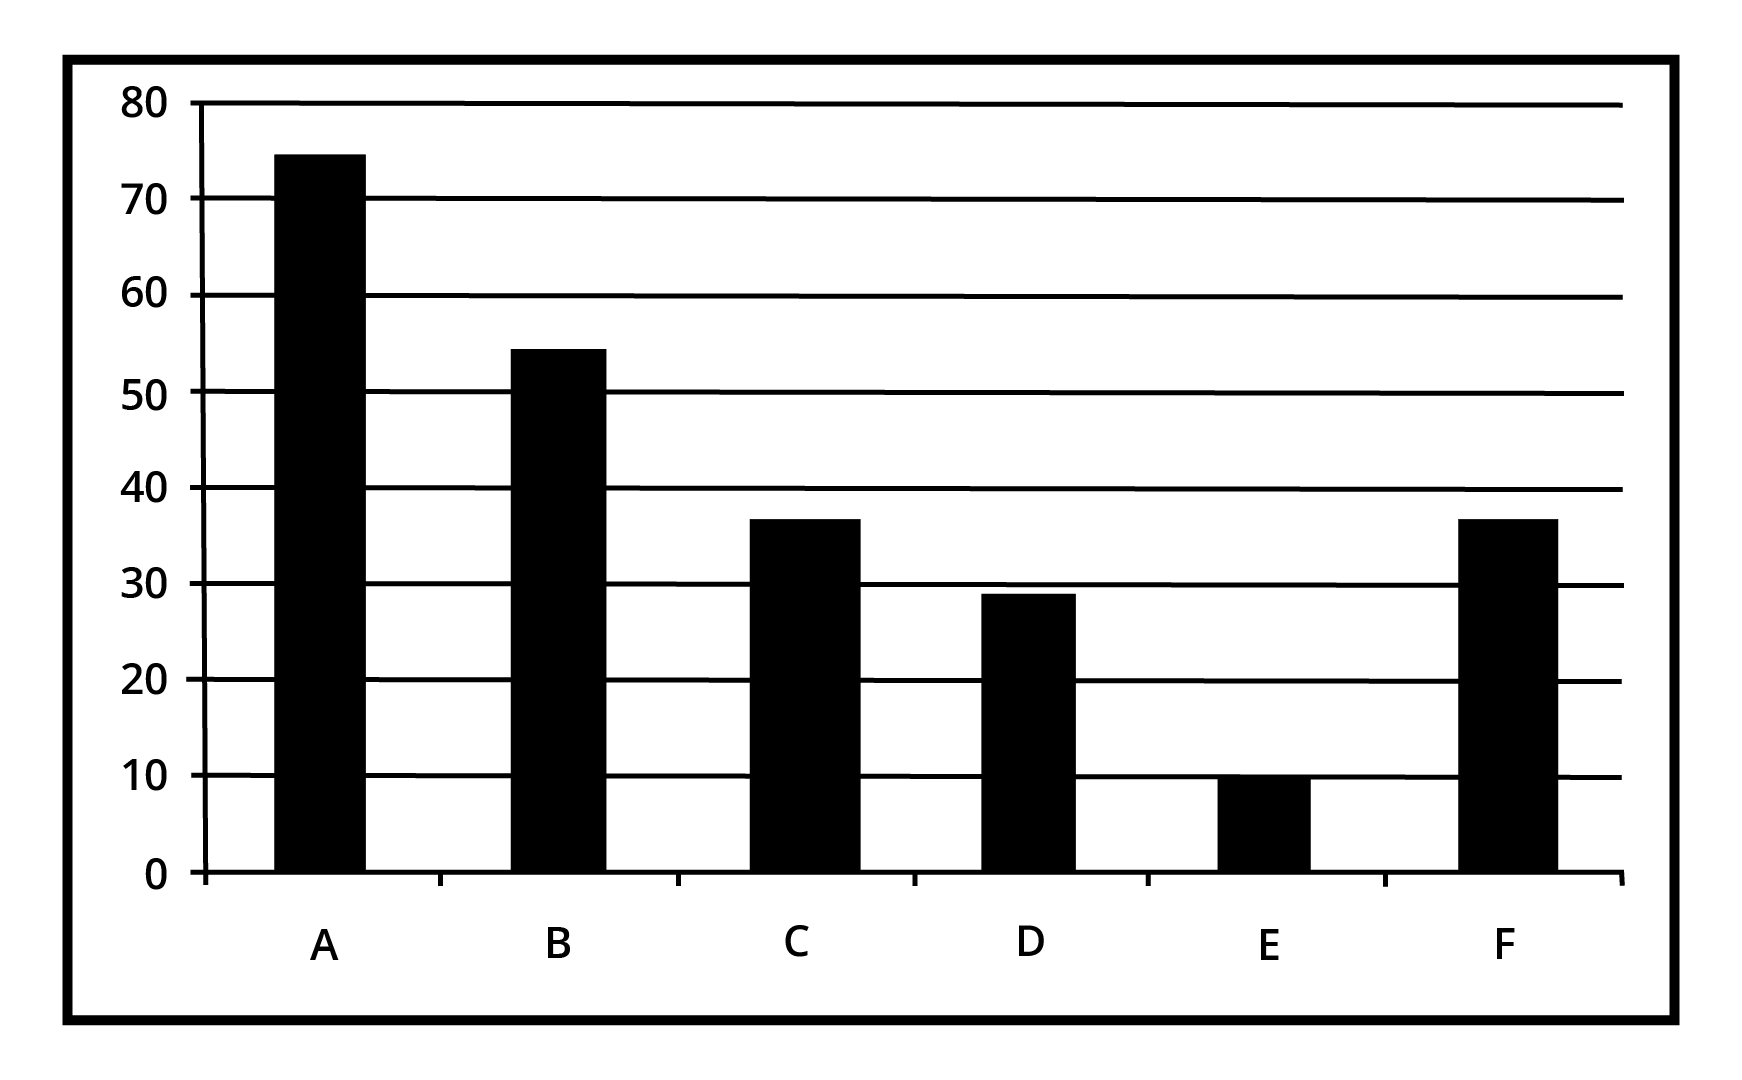
किस राजनैतिक पार्टी ने अधिकतम सीटें जीती हैं?
उत्तर: पार्टी \[A\]
प्रश्न 2. भारतीय समाज के विभिन्न क्षेत्रों में प्रति हजार लड़कों पर लड़कियों की (निकटतम दस तक की) संख्या के आँकड़े नीचे दिए गए हैं।
ऊपर दी गई सूचनाओं को एक दंड आलेख द्वारा निरूपित कीजिए।
(image will be uploaded soon)
कक्षा में चर्चा करके, बताइए कि आप इस आलेख से कौन कौन से निषर्ष निकाल सकते हैं।
उत्तर: अनुसूचित जनजाति में लिंग अनुपात बेहतर है और लड़कियों के अनुकूल है
पिछड़े जिलों में लैंगिक अनुपात बेहतर है
उत्तर: शहरी क्षेत्रों की तुलना में ग्रामीण क्षेत्रों में लैंगिक अनुपात बेहतर है।
प्रश्न 3: एक राज्य के विधान सभा के चुनाव में विभिन्न राजनैतिक पार्टियों द्वारा जीती हुई सीटों के परिणाम नीचे दिए गए हैं।
मतदान के परिणामों को निरुपित करने वाला एक दंड आलेख खींचिए।
उत्तर:
(image will be uploaded soon)
किस राजनैतिक पार्टी ने अधिकतम सीटें जीती हैं?
उत्तर: पार्टी \[\mathbf{A}\]
प्रश्नावली 14.4
प्रश्न 1. एक टीम ने फुटबॉल के \[\mathbf{10}\] मैचों में निम्नलिखित गोल किए:
\[\mathbf{2},\text{ }\mathbf{3},\text{ }\mathbf{4},\text{ }\mathbf{5},\text{ }\mathbf{0},\text{ }\mathbf{1},\text{ }\mathbf{3},\text{ }\mathbf{3},\text{ }\mathbf{4},\text{ }\mathbf{3}\]
इन गोलों के माध्य, माध्यक और बहुलक ज्ञात कीजिए।
उत्तर: माध्य \[=\] सभी प्रेक्षणों का योग ÷ प्रेक्षणों की संख्या
\[\begin{array}{*{35}{l}} =\dfrac{2+3+4+5+0+1+3+3+4+3}{10} \\ =\dfrac{28}{10}=2.8 \\ \end{array}\]
प्रश्न 2. गणित की परीक्षा में \[\mathbf{15}\] विद्यार्थियों ने \[(\mathbf{100}\]में से) निम्नलिखित अंक प्राप्त किए:
\[\mathbf{41},\mathbf{39},\text{ }\mathbf{48},\text{ }\mathbf{52},\text{ }\mathbf{46},\text{ }\mathbf{62},\text{ }\mathbf{54},\text{ }\mathbf{40},\text{ }\mathbf{96},\text{ }\mathbf{52},\text{ }\mathbf{98},\text{ }\mathbf{40},\text{ }\mathbf{42},\text{ }\mathbf{52},\text{ }\mathbf{60}\]
इन आंकड़ों के माध्य, माध्यक और बहुलक ज्ञात कीजिए।
उत्तर: माध्य \[=\] सभी प्रेक्षणों का योग \[\div \]प्रेक्षणों की संख्या
प्रेक्षणों का योग \[=39\text{ }+\text{ }40\text{ }+\text{ }40\text{ }+\text{ }41\text{ }+\text{ }42\text{ }+\text{ }46\text{ }+\text{ }48\text{ }+\text{ }52\text{ }+\text{ }52\text{ }+\text{ }52\text{ }+\text{ }54\text{ }+\text{ }60\text{ }+\text{ }62\text{ }+\text{ }96\text{ }+\text{ }98\]=\[792\]
प्रेक्षणों की संख्या \[=15\]
इसलिए, माध्य \[=\dfrac{792}{15}=52.8\]
प्रेक्षणों की संख्या असम संख्या है इसलिए माध्यक \[=\dfrac{n+1}{2}=\dfrac{15+1}{2}=8\]
\[8\]वां प्रेक्षण \[=52\]
बहुलक \[=\] सबसे अधिक बारंबारता वाली संख्या \[=52\]
प्रश्न 3. निम्नलिखित प्रेक्षणों को आरोही क्रम में व्यवस्थित किया गया है। यदि आंकड़ों का माध्यक \[\mathbf{63}\]हो तो \[\mathbf{x}\] का मान ज्ञात कीजिए।
\[29,\text{ }32,\text{ }48,\text{ }50,\text{ }x,\text{ }x+2,\text{ }72,\text{ }78,\text{ }84,\text{ }95\]
उत्तर: माध्य \[=63\text{ }=\text{ }\left( 29\text{ }+\text{ }32\text{ }+\text{ }48\text{ }+\text{ }50\text{ }+\text{ }x\text{ }+\text{ }x\text{ }+\text{ }2\text{ }+\text{ }72\text{ }+\text{ }78\text{ }+\text{ }84\text{ }+\text{ }95 \right)\text{ }\div \text{ }10\]
या, \[630=490+2x\]
या, \[2x=630490=140\]
या, \[x=\dfrac{140}{2}=70\]
प्रश्न 4. आंकड़ों \[\mathbf{14},\text{ }\mathbf{25},\text{ }\mathbf{14},\text{ }\mathbf{28},\text{ }\mathbf{18},\text{ }\mathbf{17},\text{ }\mathbf{18},\text{ }\mathbf{14},\text{ }\mathbf{23},\text{ }\mathbf{22},\text{ }\mathbf{14},\text{ }\mathbf{18}\]का बहुलक ज्ञात कीजिए।
उत्तर: बहुलक \[=\] सबसे अधिक बारंबारता वाला पद \[=14\]
प्रश्न 5: निम्न सारणी से एक फैक्टरी में काम कर रहे 60 कर्मचारियों का माध्य वेतन ज्ञात कीजिए।
उत्तर:
माध्य \[=\dfrac{\Sigma {{f}_{i}}{{x}_{i}}}{\Sigma {{f}_{i}}}\]
\[=\dfrac{305000}{60}=5083.33\]
प्रश्न 6. निम्न स्थिति पर आधारित एक उदाहरण दीजिए
माध्य ही केंद्रीय प्रवृत्ति का उपयुक्त माप है।
उत्तर: जब आंकड़ों में बहुत अधिक उतार चढ़ाव नहीं हो तो माध्य ही केंद्रीय प्रवृत्ति का उपयुक्त माप है।
माध्य केंद्रीय प्रवृत्ति का उपयुक्त माप नहीं है, जबकि माध्यक एक उपयुक्त माप है।
उत्तर: जब आंकड़ों में बहुत अधिक उतार चढ़ाव हो तो माध्यक ही केंद्रीय प्रवृत्ति का उपयुक्त माप है।
NCERT Solutions for Class 9 Maths Chapter 14 Statistics in Hindi
Chapter-wise NCERT Solutions are provided everywhere on the internet with an aim to help the students to gain a comprehensive understanding. Class 9 Maths Chapter 14 solution Hindi mediums are created by our in-house experts keeping the understanding ability of all types of candidates in mind. NCERT textbooks and solutions are built to give a strong foundation to every concept. These NCERT Solutions for Class 9 Maths Chapter 14 in Hindi ensure a smooth understanding of all the concepts including the advanced concepts covered in the textbook.
NCERT Solutions for Class 9 Maths Chapter 14 in Hindi medium PDF download are easily available on our official website (vedantu.com). Upon visiting the website, you have to register on the website with your phone number and email address. Then you will be able to download all the study materials of your preference in a click. You can also download the Class 9 Maths Statistics solution Hindi medium from Vedantu app as well by following the similar procedures, but you have to download the app from Google play store before doing that.
NCERT Solutions in Hindi medium have been created keeping those students in mind who are studying in a Hindi medium school. These NCERT Solutions for Class 9 Maths Statistics in Hindi medium pdf download have innumerable benefits as these are created in simple and easy-to-understand language. The best feature of these solutions is a free download option. Students of Class 9 can download these solutions at any time as per their convenience for self-study purpose.
These solutions are nothing but a compilation of all the answers to the questions of the textbook exercises. The answers/ solutions are given in a stepwise format and very well researched by the subject matter experts who have relevant experience in this field. Relevant diagrams, graphs, illustrations are provided along with the answers wherever required. In nutshell, NCERT Solutions for Class 9 Maths in Hindi come really handy in exam preparation and quick revision as well prior to the final examinations.


FAQs on NCERT Solutions For Class 9 Maths in Hindi Chapter 14 Statistics (2025-26)
1. Where can I find complete and accurate NCERT Solutions for Class 9 Maths Chapter 14 (Statistics)?
Vedantu provides comprehensive, exercise-wise NCERT Solutions for Class 9 Maths Chapter 14, Statistics. These solutions are crafted by subject matter experts and provide a detailed, step-by-step guide to solving every problem in the NCERT textbook, ensuring you understand the correct methodology for your exams.
2. Are these NCERT Solutions for Class 9 Maths Chapter 14 updated for the latest CBSE 2025-26 syllabus?
Yes, all NCERT Solutions on Vedantu, including those for Class 9 Maths Chapter 14, are fully updated and aligned with the latest CBSE/NCERT syllabus for the academic year 2025-26. Our experts ensure that every solution adheres to the current curriculum and marking guidelines.
3. What is the correct step-by-step method to construct a histogram for continuous class intervals as explained in the NCERT solutions?
The NCERT solutions explain the following method for constructing a histogram:
Step 1: Take the given class intervals along the x-axis and the corresponding frequencies along the y-axis.
Step 2: For each class interval, draw a rectangle with the class interval as the base and the frequency as the height.
Step 3: Since the class intervals are continuous, the rectangles will be adjacent to each other with no gaps. If the intervals are discontinuous, you must first make them continuous by adjusting the class limits.
4. How do the NCERT Solutions for Chapter 14 explain the process of finding the mean, median, and mode for ungrouped data?
The solutions provide clear, formula-based methods for each measure of central tendency:
Mean: It is calculated by summing all the observations and dividing by the total number of observations.
Median: The data is first arranged in ascending order. If the number of observations (n) is odd, the median is the ((n+1)/2)th term. If n is even, it's the average of the (n/2)th and ((n/2)+1)th terms.
Mode: This is simply the observation that appears most frequently in the dataset.
5. What is the main difference between constructing a bar graph and a histogram, according to the methods shown in the NCERT Solutions?
The key difference highlighted in the NCERT Solutions is the nature of the data they represent. A bar graph is used for discrete, separate categories, so there are gaps between the bars. In contrast, a histogram is used for continuous data in the form of class intervals, and therefore, the rectangular bars are drawn adjacent to each other without any gaps.
6. Why is it crucial to follow the precise steps given in the NCERT Solutions when solving statistics problems for exams?
Following the precise steps from NCERT Solutions is crucial because CBSE evaluates not just the final answer but the methodology itself. Each step, such as correctly labelling axes, choosing the right scale, and showing calculation formulas, carries marks. Skipping steps can lead to mark deductions and increases the chance of calculation errors, especially in complex problems involving frequency distribution tables or graphical representations.
7. How do the NCERT Solutions for Class 9 Statistics help build a conceptual foundation for more advanced topics in Class 10?
These solutions do more than just solve problems; they build a strong foundation. By mastering the Class 9 concepts of data presentation (histograms, frequency polygons) and measures of central tendency for ungrouped data, you are well-prepared for Class 10. In Class 10, you will apply similar principles to more complex grouped data and learn advanced methods for calculating mean, median, and mode, which rely on the foundational understanding developed in Class 9.
8. How do the solutions explain the method for drawing a frequency polygon correctly?
The NCERT solutions outline two correct methods:
Without a histogram: Calculate the class mark (mid-point) for each class interval. Plot these class marks on the x-axis against their corresponding frequencies on the y-axis. Join these points with straight line segments.
With a histogram: First, draw a histogram for the data. Then, join the mid-points of the tops of the adjacent rectangles with line segments to form the polygon.