


Solved NCERT Questions For Class 8 Maths Chapter 15 In Hindi - Free PDF
प्रश्नावली 15.1
1. निम्न आलोख, किसी अस्पताल में एक रोगी का प्रति घंटे लिया गया तापमान दर्शाता हैं:
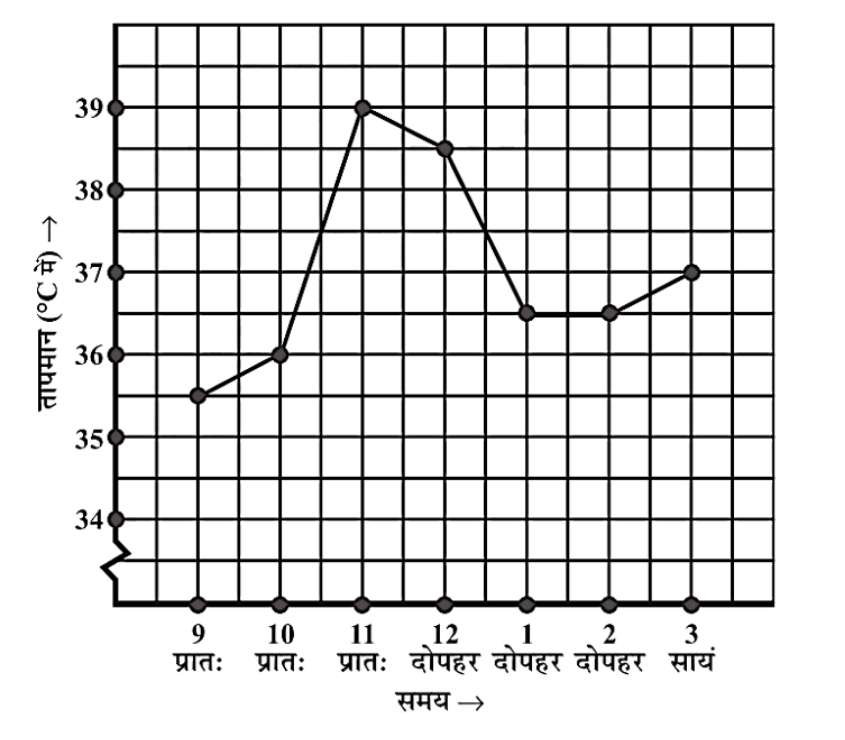
a. रोगी का तापमान 1 बजे दोपहर क्या था?
उत्तर: रोगी का तापमान दोपहर 1 बजे 36.5° C था |
b. रोगी का तापमान 38.5° C कब था?
उत्तर: रोगी का तापमान दोपहर 12 बजे 38.5° C था ।
c. इस पूरे अंतराल में रोगी का तापमान दो बार एक समान ही था । ये दो समय, क्या-क्या थे?
उत्तर: रोगी का तापमान दोपहर 1 बजे और 2 बजे बराबर था ।
d .1.30 बजे दोपहर रोगी का तापमान क्या था? इस निष्कर्ष पर आप कैसे पहुँचे?
उत्तर: रोगी का तापमान दोपहर 1.30 बजे 36.5° C था। आलेख से स्पस्ट है की x अक्ष पर समय 1 बजे और2 बजे के बीच तापमान स्थिर है | समय 1.30 बजे y-अक्ष पर मान 36°C और 37°C के बीच में हैं इसीलिए तापमान 36.5°C हैं।
e .किन अंतरालों में रोगी का तापमान बढ़ने का रुझान दर्शाता हैं।
उत्तर: रोगी का तापमान बढ़ने का रुझान प्रातः 9 से 11 बजे तक दर्शाता है|
2. एक निर्माता कंपनी की विभिन्न वर्षों में की गयी बिक्री निम्न आलोख द्वारा दर्शाई गई हैं:
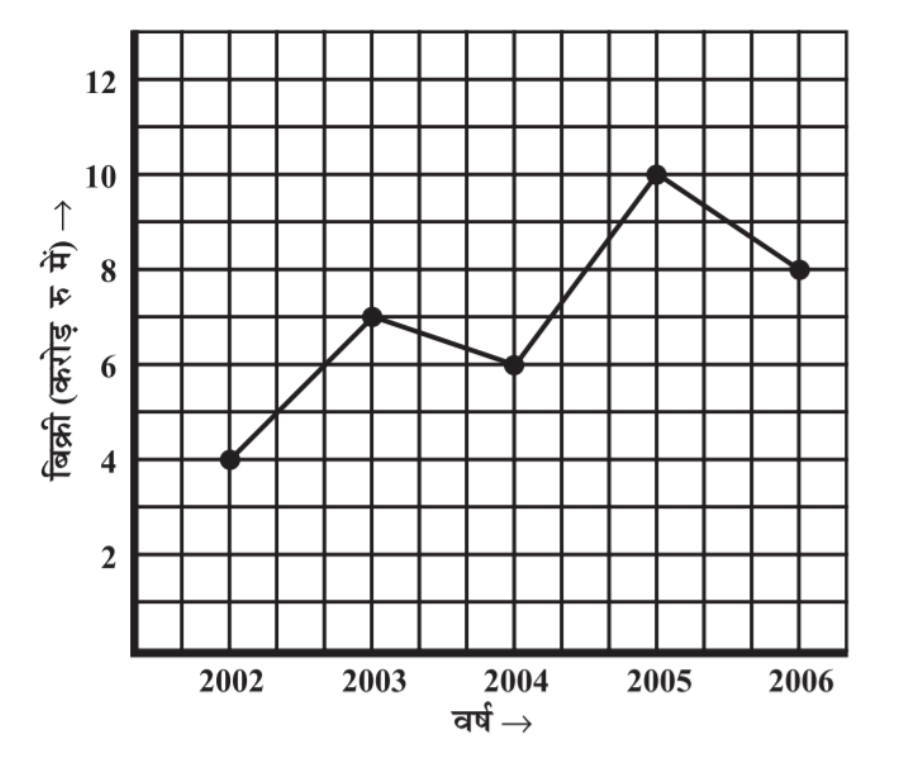
a. (i) वर्ष 2002 में (ii) वर्ष 2006 में कितनी बिक्री थी?
उत्तर: (i) 2002 में बिक्री 4 करोड़ रूपये और (ii) 2006 में 8 करोड़ रूपये
b. (i) वर्ष 2003 में (ii) वर्ष 2005 में कितनी बिक्री थी?
उत्तर: (i) 2003 में बिक्री 7 करोड़ रूपये और (ii) 2005 में 10 करोड़ रूपये
c. वर्ष 2002 तथा वर्ष 2006 की बिक्रियों में कितना अंतर था?
उत्तर: वर्ष 2002 में बिक्री = 8 करोड़
वर्ष 2006 में बिक्री =4 करोड़
दोनों में अंतर= 8 - 4 = 4 करोड़ रूपये
d. किस अंतराल में बिक्रियों का यह अंतर सबसे अधिक था?
उत्तर: वर्ष 2004 से 2005 में अधिक अंतर बिक्री में था|यह अंतर 4 करोड़ रूपये था|
3. वनस्पति विज्ञान के एक प्रयोग में समान प्रयोगशाला परिस्थिथियों में दो पौधे A तथा B उगाए गए। तीन सप्ताहों तक उनकी ऊँचाइयों को हर सप्ताह के अंत में मापा गया। परिणामों को निम्न आलोख में दर्शाया गया है
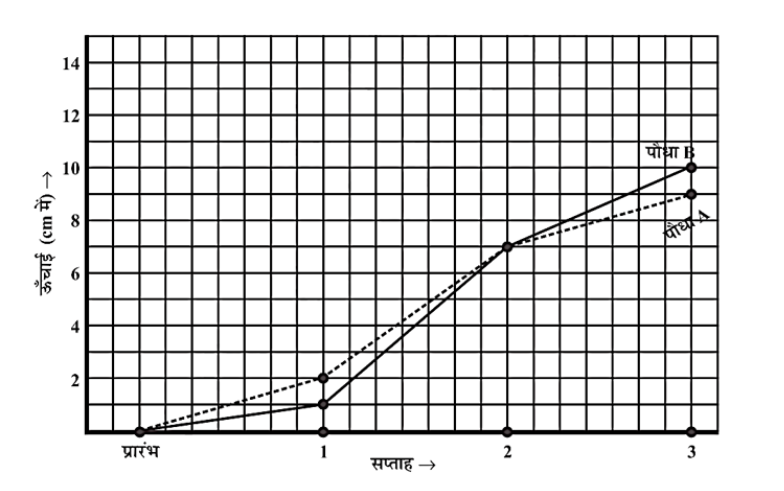
a. (i) 2 सप्ताह बाद (ii) 3 सप्ताह बाद पौधे A की ऊँचाई कितनी थी?
उत्तर: (i) 2 सप्ताह के बाद पौधा A, 7 cm ऊँचा हुआ और (ii) 3 सप्ताह के बाद वह 9 cm ऊँचा हुआ।
b. (i) 2 सप्ताह बाद (ii) 3 सप्ताह बाद पौधे B की ऊँचाई कितनी थी?
उत्तर: (i)2 सप्ताह के बाद पौधा B , 7 cm ऊँचा हुआ और (ii) 3 सप्ताह के बाद वह 10 cm ऊँचा हुआ ।
c. तीसरे सप्ताह में पौधे A की ऊँचाई कितनी बढी ?
उत्तर: तीसरे सप्ताह में पौधा A की ऊचाई = 9 - 7 = 2 cm
d. दूसरे सप्ताह की अंत से तीसरे सप्ताह के अंत तक पौधे B की B ऊँचाई कितनी बढी ?
उत्तर: दूसरे सप्ताह के अंत से तीसरे सप्ताह की अंत तक पौधा B की ऊंचाई= 10 - 7=3 cm
e. किस सप्ताह में पौधे A की ऊँचाई सबसे अधिक बदी ?
उत्तर: पौधा A की ऊँचाई दूसरे सप्ताह में अधिक बढ़ी।
f. किस सप्ताह में पौधे B की ऊँचाई सबसे कम बढी ?
उत्तर: पौधा B की ऊँचाई पहले सप्ताह में सबसे कम बढ़ी|
g. क्या किसी सप्ताह में दोनों पौधों की ऊँचाई समान थी? पहचानिए ।
उत्तर: हाँ , दूसरे सप्ताह के अंत में पौधा A और पौधा B की ऊँचाई समान थी।
4. निम्न आलोख, किसी सप्ताह के प्रत्येक दिन के लिए पूर्वानुमानित तापमान तथा वास्तविक तापमान दर्शाता हैं:
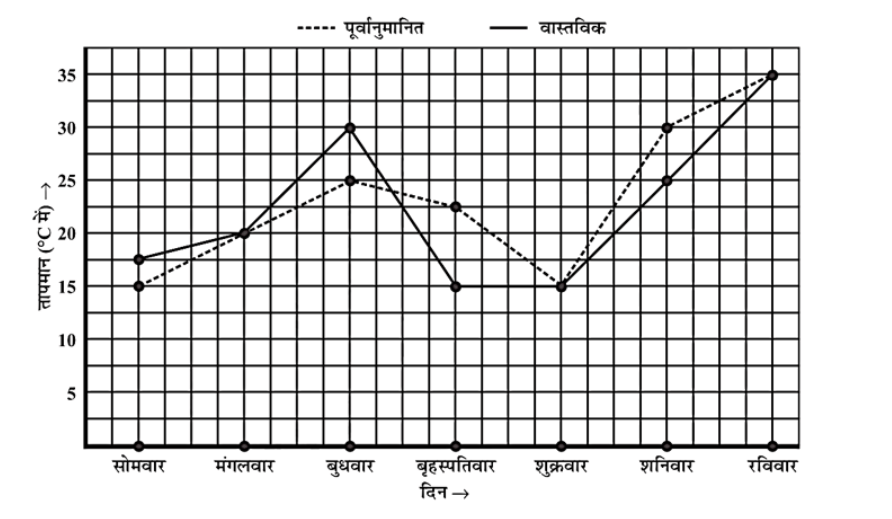
a. किस दिन पूर्वानुमानित तापमान व वास्तविक तापमान समान था ?
उत्तर: मंगलवार, शुक्रवार और रविवार पूर्वानुमानित तापमान , वास्तविक तापमान के समान थे।
b. सप्ताह में पूर्वानुमानित अधिकतम तापमान क्या था?
उत्तर: सप्ताह में पूर्वानुमानित अधिकतम तापमान = 35° C था।
c. सप्ताह में वास्तविक न्यूनतम तापमान क्या था?
उत्तर: सप्ताह में वास्तविक न्यूनतम तापमान = 15° C था।
d. किस दिन वास्तविक तापमान व पूर्वानुमानित तापमान में अंतर सर्वाधिक था?
उत्तर: बृहस्पतिवार के दिन वास्तविक तापमान व पूर्वानुमानित तापमान में अंतर सर्वाधिक था।
5. निम्न तालिका प्रयोग कर एक रैखिक आलोख बनाइए
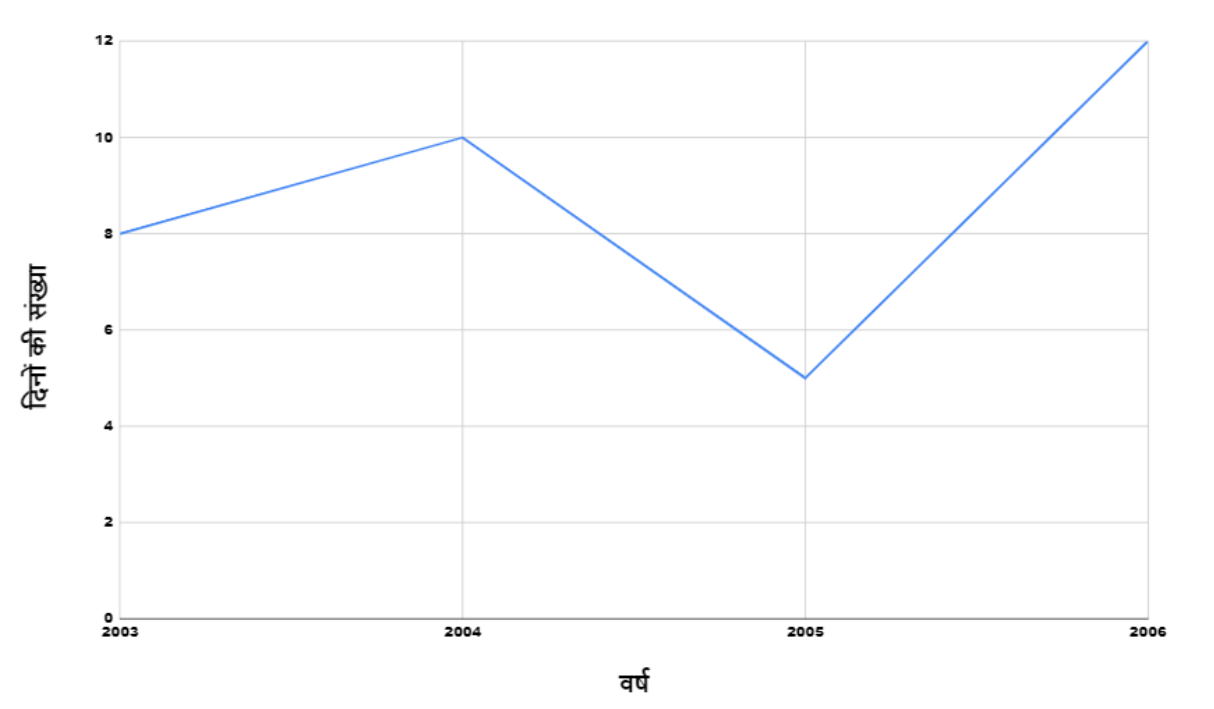
(a) विभिन्न वर्षों में किसी पर्वतीय नगर में हिमपात के दिनों की संख्या:
उत्तर:
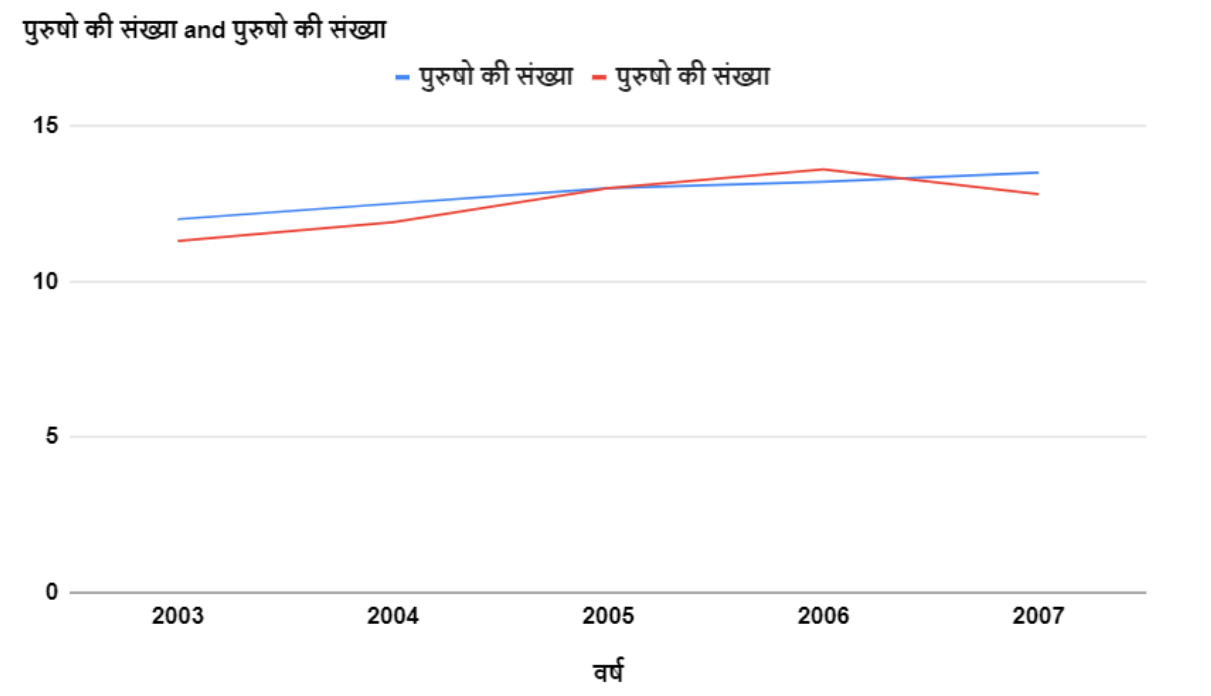
(b) विभिन्न वर्षों में के गाँव में पुरुषों व स्त्रियों की संख्या (हज़ारों में)
उत्तर:
6. एक डाकिया किसी नगर के पास ही स्थित एक उपनगर में एक व्यापारी को पार्सल पहुँचाने के लिए साइकिल पर जाता हैं। विभिन्न समयों पर नगर से उसकी दूरियाँ निम्न आलोख द्वारा दर्शाई गई हैं।
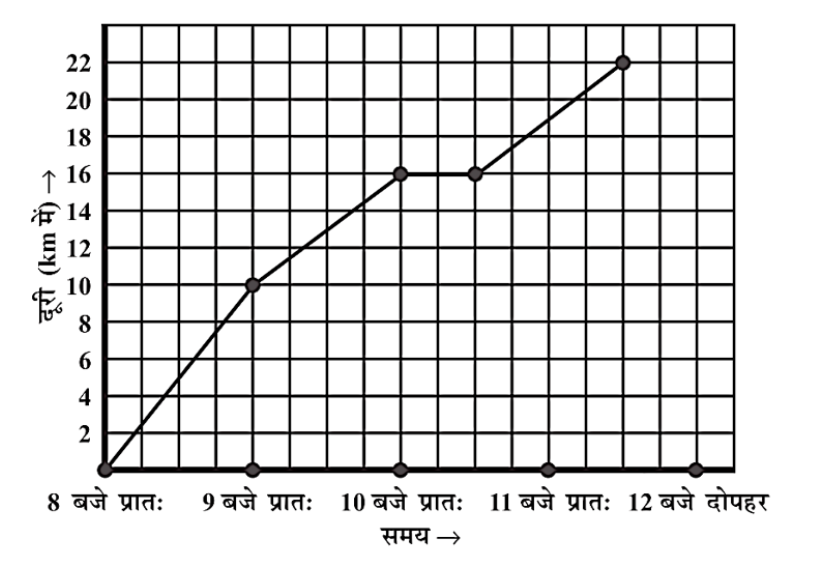
a. x - अक्ष पर समय दर्शाने के लिए क्या पैमाना प्रयोग किया गया है?
उत्तर: x-अक्ष पर 4 इकाई = 1 घंटा
b. उसने पूरी यात्रा के लिए कितना समय लिया?
उत्तर: डाकिया ने पूरी यात्रा के लिए 312घंटे का समय लिया।
c. व्यापारी के स्थान की नगर से दूरी कितनी हैं?
उत्तर: व्यापारी के स्थान की नगर से कुल दूरी 22 km है।
d. क्या, डाकिया रास्ते में कहीं रुका? विवरण दीजिए।
उत्तर: हाँ,डाकिया रास्ते में रुका था | क्षैतिज अक्ष पर प्रातः 10 से 10:30 तक वह रुका था।
e.किस अंतराल में उसकी चाल सबसे अधिक थी?
उत्तर: प्रात: 8 से 9 अन्तराल में उसकी चाल सबसे अधिक थी।
7. निम्न अलोखों में कौन-कौन से आलोख समय व तापमान के बीच संभव हैं? तर्क के साथ अपने उतर दीजिए।
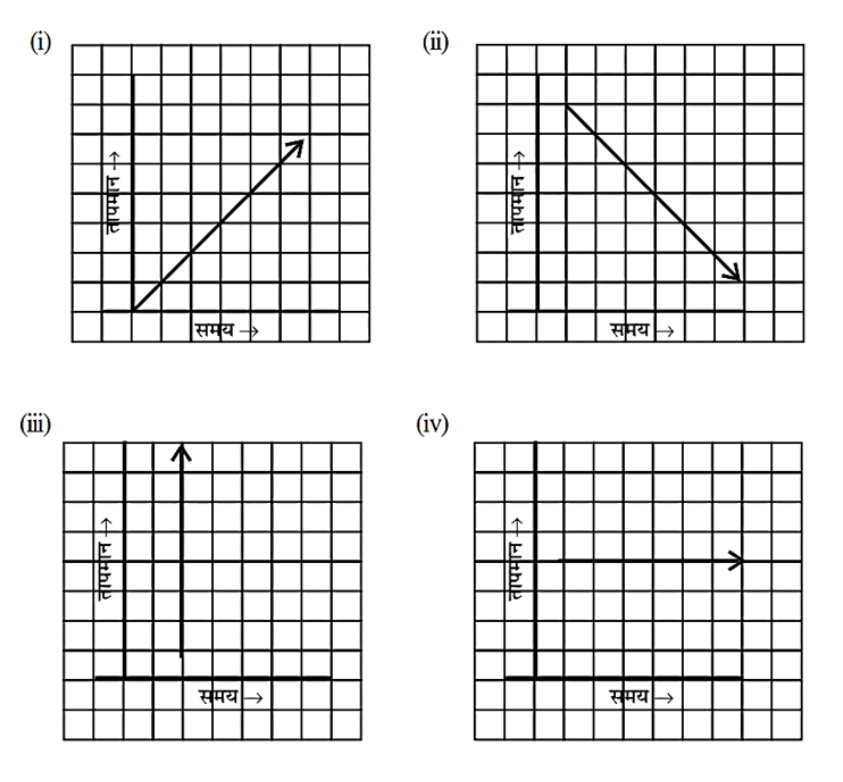
उत्तर :
(i) समय व तापमान के बीच ऐसा आलेख संभव है क्योकि समय के साथ तापमान बढ़ता हुआ दिखाई दे रहा है ।
(ii) समय व तापमान के बीच ऐसा आलेख संभव है क्योकि समय के साथ तापमान कम होता हुआ दिखाई दे रहा है।
(iii) समय व तापमान के बीच ऐसा आलेख संभव नही है क्योकि समय के साथ तापमान बहुत अधिक बढ़ रहा है|
(iv) समय व तापमान के बीच ऐसा आलेख संभव है क्योकि तापमान एकसमान है।
प्रशनावली 15.2
1. निम्न बिंदुओं को एक वर्गांकित काग़ज़ (Graph Sheet) पर अंकित कीजिए और जाँचिए की क्या वे सभी एक सरल रेखा पर स्थित हैं?
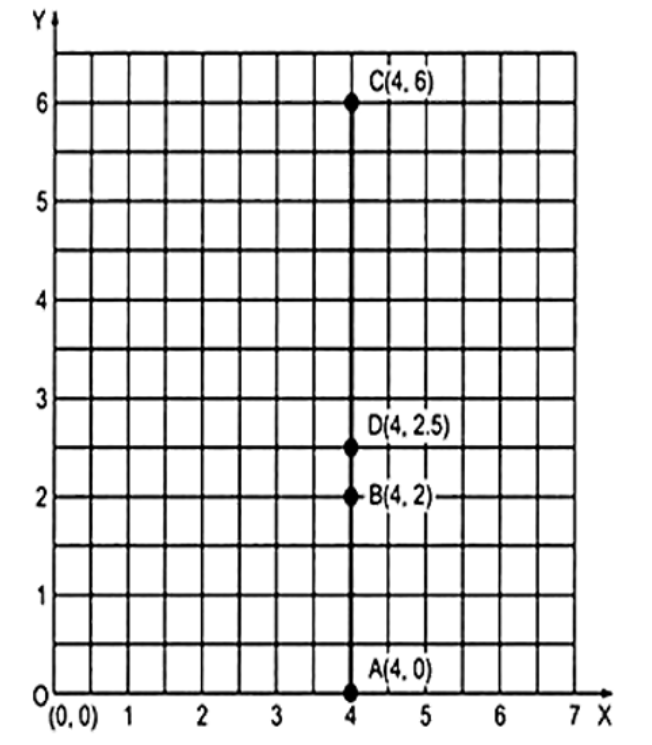
(a). A (4,0), B (4,2), C (4,6), D(4,2.5)
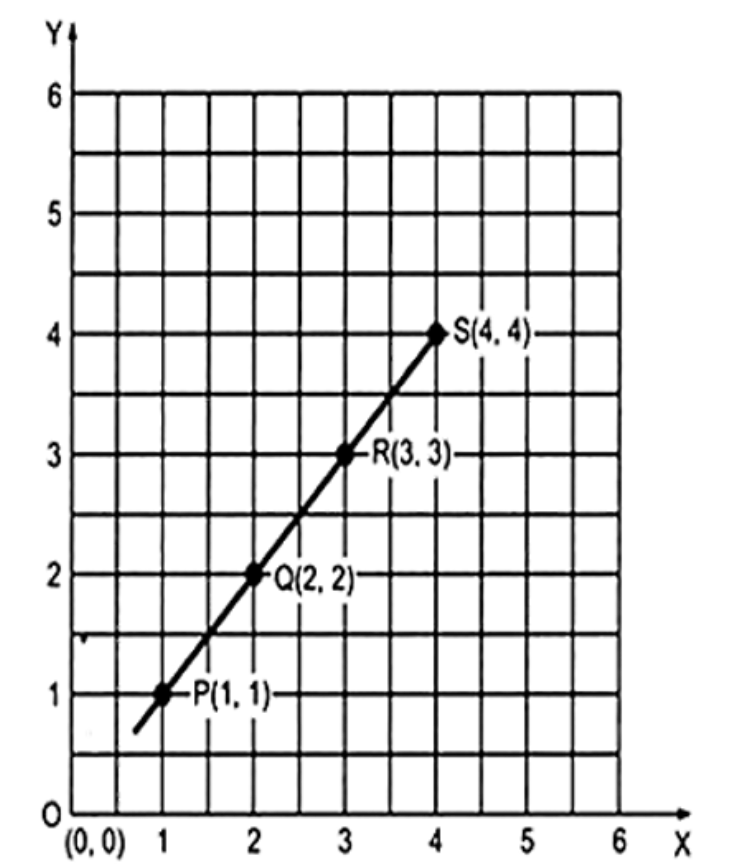
(b). P(1,1), Q (2, 2), R(3,3), S (44)
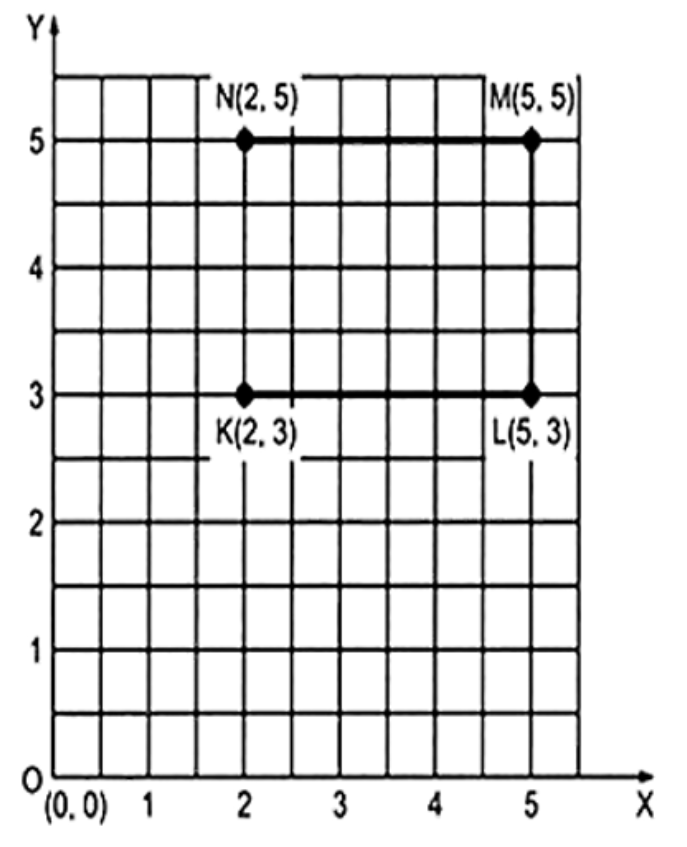
(c). K(2,3), L(5,3), M (5,5), N (25)
उत्तर:
(a) आलेख में बिंदु A,BC और D एक ही रेखा में स्थित है|
(b)आलेख में बिंदु P,Q,R और S एक ही रेखा में स्थित है|
(c) आलेख में बिंदु K,L,M और N एक ही रेखा में स्थित नही है|
2. बिंदुओं ( 2, 3 ) तथा ( 3, 2 ) में से गुज़रती हुई एक सरल रेखा खिचिए। इन बिंदुओं के निर्देशांक लिखिए जिन पर यह रेखा x अक्ष तथा Y-अक्ष को प्रतिच्छेद करती हैं।
उत्तर:
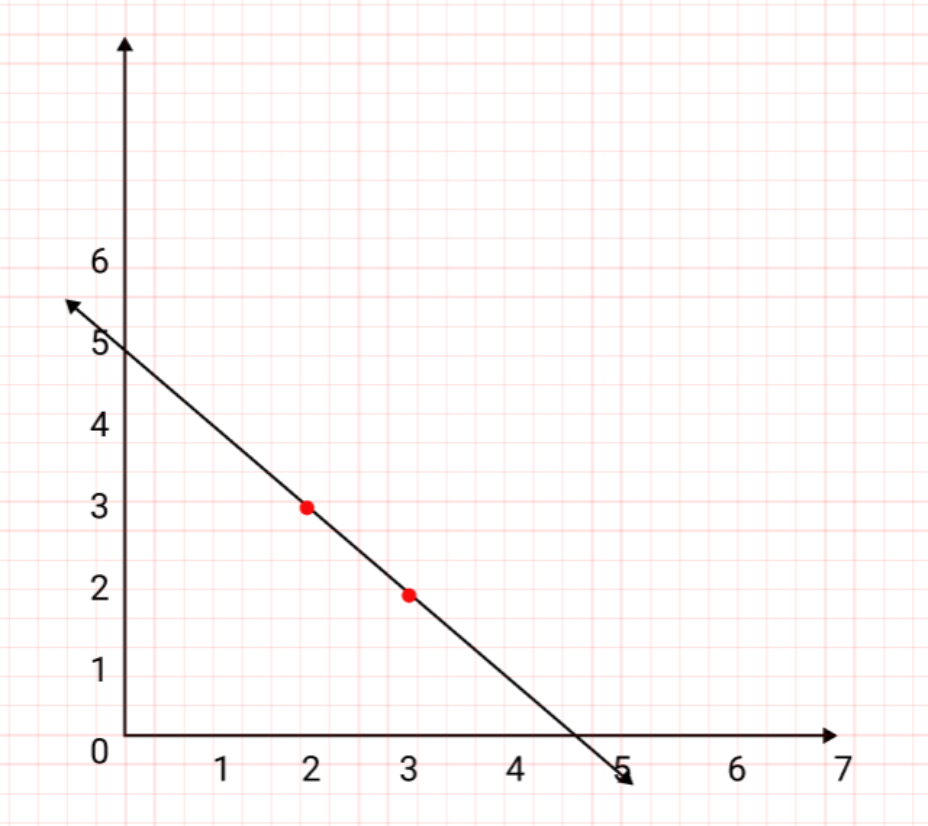
यह रेखा क्षैतिज अक्ष को (4.7,0) और उर्ध्वाधर अक्ष को (0,5) पर काटती है|
3. आलोख में बनाई गयी आकृतियों में प्रत्येक के शीर्षों के निर्देशांक लिखिए।
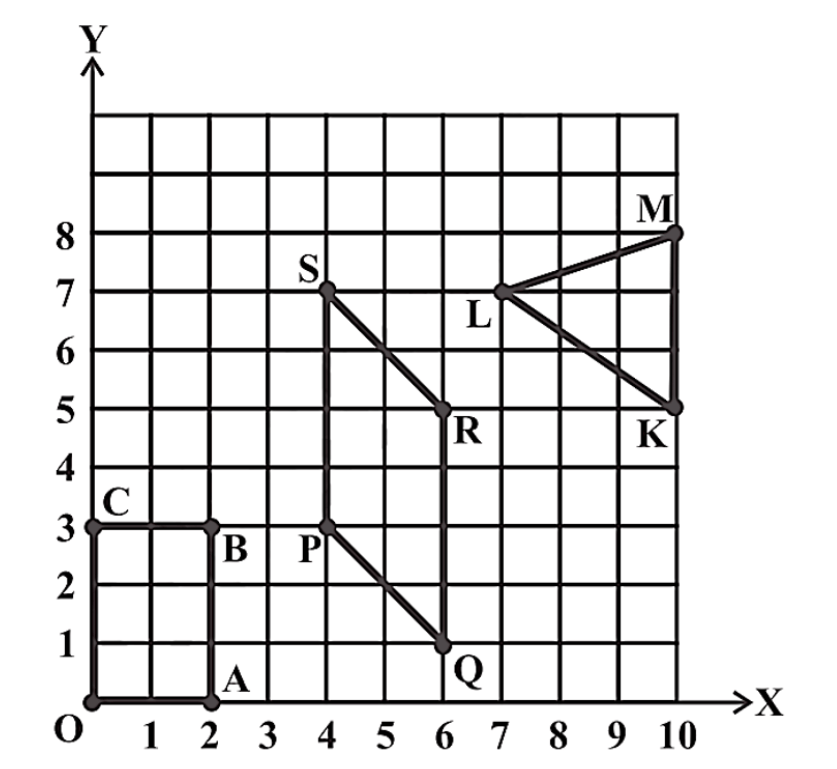
उत्तर: OABC के शीर्ष निर्देशांक - O (0,0), A (2,0), B (2,3) और C (0,3)
PQRS के शीर्ष निर्देशांक - P (4,3), Q (6,1) R (6,5) और 5 ( 4, 7)
LMK के शीर्ष निर्देशांक - L (7,7), M (10,8) और K (10.5)
4. निम्न कथनों में कान सा सत्य हैं तथा कान सा असत्य? असत्य को ठीक कीजिए ।
(i) कोई बिंदु जिसका X-निर्देशांक शून्य हैं तथा निर्देशांक शुन्यतर हैं, Y-अक्ष पर स्थित होता हैं।
उत्तर: सत्य
(ii) कोई बिंदु जिसका Y-निर्देशांक शून्य हैं तथा x-निर्देशांक 5 हैं, Y-अक्ष पर स्थित होगा।
उत्तर: असत्य, क्योंकि यदि बिंदु का Y-निर्देशांक शून्य हैं तथा x-निर्देशांक 5 हैं तब वह X-अक्ष पर होगा।
(iii) मूल बिंदु के निर्देशांक (0,0) हैं।
उतर: सत्य
प्रश्नावली 15.3
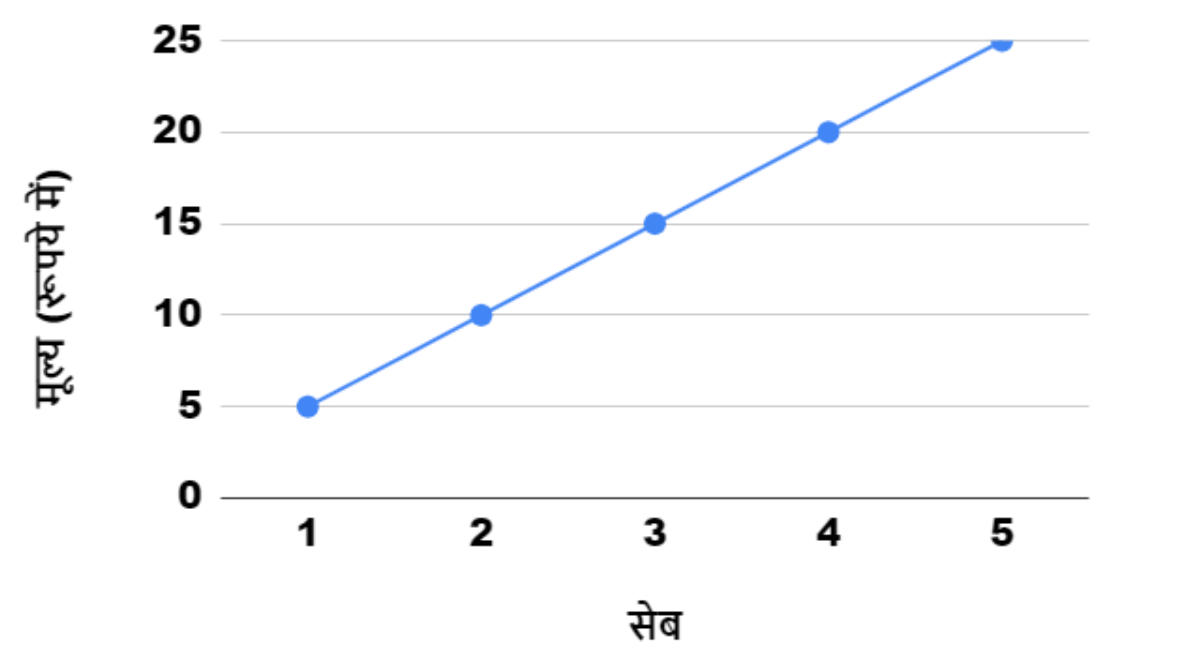
1. उप्युक्त पेमाने प्रयोग करते हुए, निम्न तालिकाओं में दी गयी राशियो के लिए आलेख बनाईये (a) सेबो का मूल्य
उत्तर: आलेख
(b) कार द्वारा तय की गयी दूरी
उत्तर: आलेख
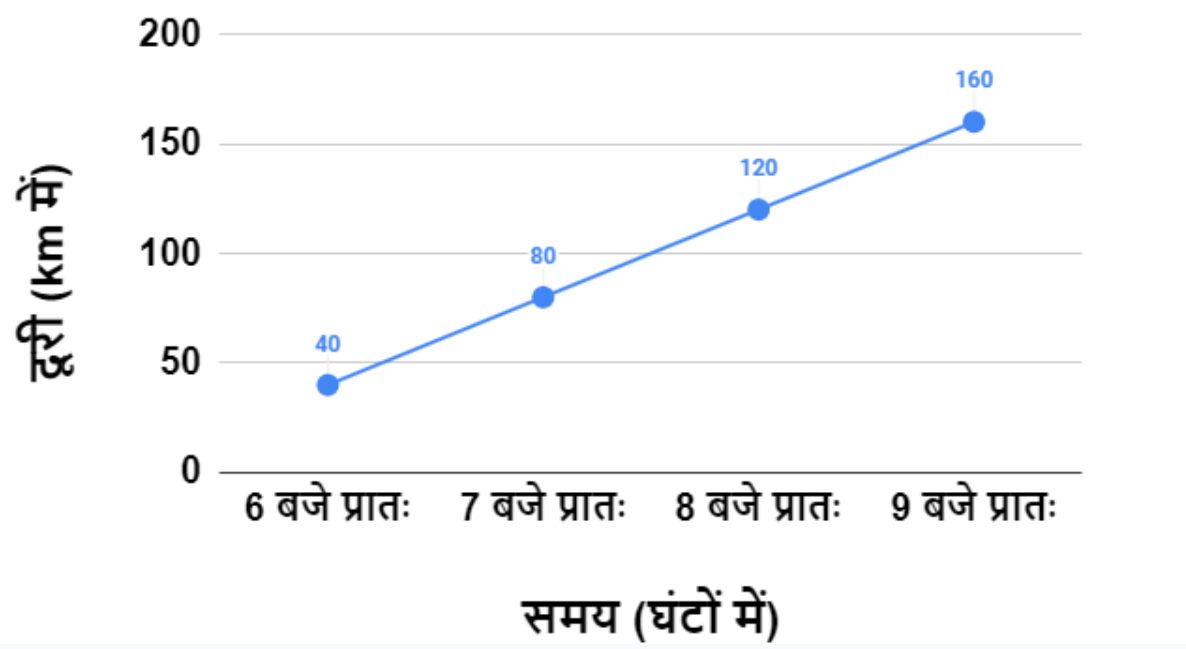
(i) 7:30 बजे प्रात: व 8 बजे प्रातः के अन्तराल में कार द्वारा कितनी दूरी तय की गयी?
उत्तर: 7:30 बजे प्रात: व 8 बजे प्रातः के अन्तराल में 20 km दूरी तय की गयी
(ii) कार के 100 कम दूरी तय कर लेने पर समय क्या था?
उत्तर: कार के 100 कम दूरी तय कर लेने पर समय= प्रातः 7:30 बजे
(c) जमा धन पर वार्षिक ब्याज
उत्तर: आलेख
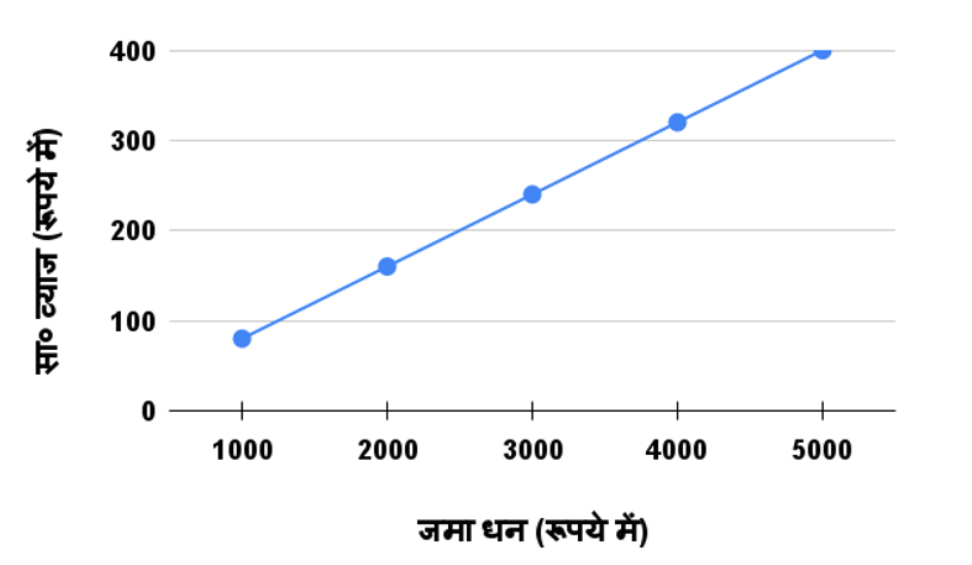
(i) क्या आलेख मूल बिन्दू से गुजरता है?
उत्तर: हाँ आलेख मूल बिन्दू से गुजरता है|
(ii) आलेख से 2500 रूपये का वार्षिक ब्याज ज्ञात कीजिए।
उत्तर: 200 रूपये
(iii) 280 रूपये ब्याज प्राप्त करने के लिए कितना धन जमा करना होगा?
उत्तर: 3500 रूपये
2. निम्न तालिकाओ के लिए आलेख कीजिये।
(i)
उत्तर: आलेख
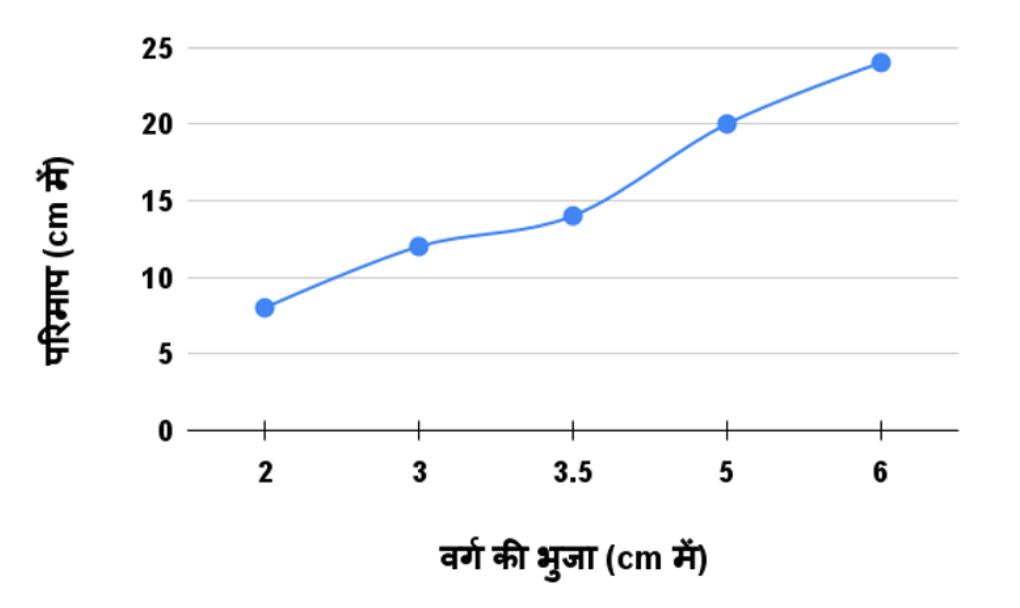
क्या यह रैखिक आलेख है?
उत्तर: हाँ, यह आलेख रैखिक है|
(ii)
उत्तर: आलेख
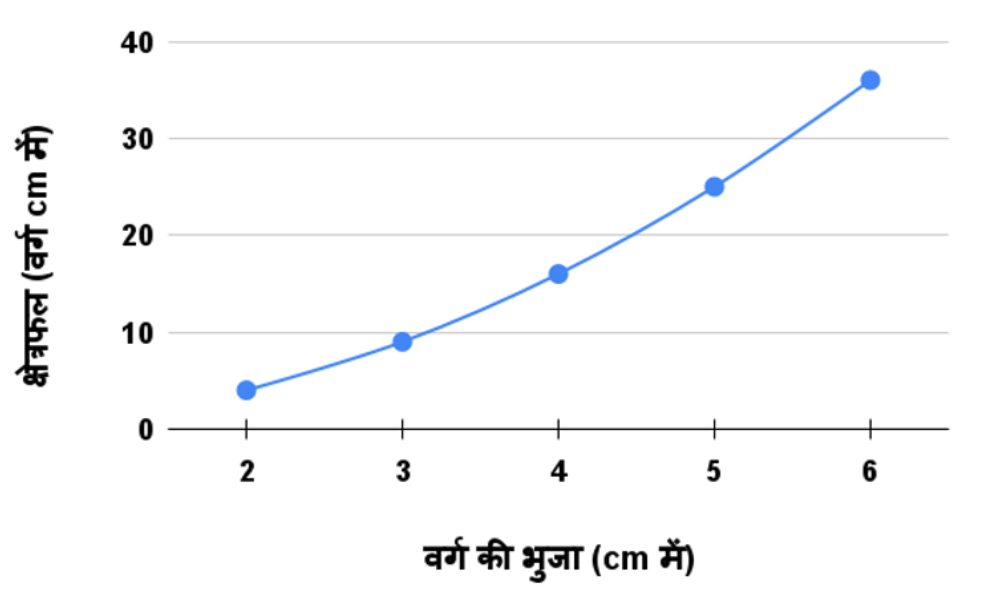
यह रैखिक आलेख है?
उत्तर: नहीं यह आलेख रैखिक नही है|
NCERT Solutions for Class 8 Maths Chapter 15 Introduction to Graphs in Hindi
Chapter-wise NCERT Solutions are provided everywhere on the internet with an aim to help the students to gain a comprehensive understanding. Class 8 Maths Chapter 15 solution Hindi medium is created by our in-house experts keeping the understanding ability of all types of candidates in mind. NCERT textbooks and solutions are built to give a strong foundation to every concept. These NCERT Solutions for Class 8 Maths Chapter 15 in Hindi ensure a smooth understanding of all the concepts including the advanced concepts covered in the textbook.
NCERT Solutions for Class 8 Maths Chapter 15 in Hindi medium PDF download are easily available on our official website (vedantu.com). Upon visiting the website, you have to register on the website with your phone number and email address. Then you will be able to download all the study materials of your preference in a click. You can also download the Class 8 Maths Introduction to Graphs solution Hindi medium from Vedantu app as well by following the similar procedures, but you have to download the app from Google play store before doing that.
NCERT Solutions in Hindi medium have been created keeping those students in mind who are studying in a Hindi medium school. These NCERT Solutions for Class 8 Maths Introduction to Graphs in Hindi medium pdf download have innumerable benefits as these are created in simple and easy-to-understand language. The best feature of these solutions is a free download option. Students of Class 8 can download these solutions at any time as per their convenience for self-study purpose.
These solutions are nothing but a compilation of all the answers to the questions of the textbook exercises. The answers/solutions are given in a stepwise format and very well researched by the subject matter experts who have relevant experience in this field. Relevant diagrams, graphs, illustrations are provided along with the answers wherever required. In nutshell, NCERT Solutions for Class 8 Maths in Hindi come really handy in exam preparation and quick revision as well prior to the final examinations.

FAQs on NCERT Solutions For Class 8 Maths In Hindi Chapter 15 Introduction To Graphs - 2025-26
Q1. Why should I opt for NCERT Solutions for Class 8 Maths Chapter 15?
Ans: Vedantu's NCERT Solutions for Chapter 15 Class 8 Maths are recommended for students because these are expert-created answers given in the most easily understandable design and are available free of cost. All of the concepts are straightforward and have the main aim of simplifying the topics to the students. These solutions help in giving advanced insights into the chapter as well with their step-wise answer analysis. Thus, studies are made easy with these solutions.
Q2. Are NCERT Solutions for Class 8 Maths Chapter 15 difficult to learn?
Ans: Not at all. These NCERT Solutions follow an easy, concise, and direct design for the students such that each student can understand the concept. The Chapter 15 solutions are important because they help students develop their mental and logical thinking abilities. Regular practice of these solutions not only makes it easier to answer these questions but also helps students achieve great scores in their exams.
Q3. What are the important concepts to learn from Class 8 Maths Chapter 15?
Ans: Chapter 15 of Class 8 Maths focuses on graphs. As the title of the chapter suggests, students are introduced to and made familiar with graphs and their types. The most important concepts from the chapter are listed out below:
Types of graphs - bar graph, pie chart, histogram, line graph, and linear graph
Applications of these graphs
Data interpretation through these graphs
Pictorial representation of numerical values
Q4. What are the different types of graphs given in Chapter 15 of Class 8 Maths?
Ans: The chapter ‘Introduction To Graphs’ teaches students about 5 different types of graphs.
A bar graph shows a comparison amongst different categories.
A pie chart is a kind of circular graph showing the relationship between a whole and a single part.
A histogram is a graph showing data in intervals.
A line graph shows how data changes continuously over a period of time.
A linear graph shows a line graph as a whole unbroken line.
Q5. What is a pie chart and bar graph?
Ans: In Chapter 15 of Class 8 Maths, students learn about different types of graphs, two being pie charts and bar graphs.
A pie chart is a circle graph that shows the pictorial representation of a given data set illustrating numerical problems in different sectors.
A bar graph, on the other hand, shows a pictorial representation where data is organized into uniform bars that vary in heights.
Both these graphs are chiefly used to show the comparison among different data categories.