


What is Microsoft Excel and How Do Formulas and Functions Work
Microsoft Excel is a powerful spreadsheet software widely used for data management, calculation, and analysis. In computer science and information technology, Excel plays an important role in organizing structured data, performing mathematical operations, and creating visual reports using charts and tables. It is used by students, professionals, businesses, and researchers to process large amounts of information efficiently. Understanding Microsoft Excel helps learners build strong data handling and analytical skills, which are essential in today’s digital world.
Definition and Meaning
Microsoft Excel is a spreadsheet program developed by Microsoft that allows users to store, organize, calculate, and analyze data in tabular form using rows and columns.
- Spreadsheet - A digital sheet used to manage data in rows and columns.
- Workbook - An Excel file that contains one or more worksheets.
- Worksheet - A single spreadsheet within a workbook.
- Cell - The intersection of a row and a column where data is entered.
- Formula - An expression used to perform calculations in Excel.
How It Works - Working Principle
The working of Microsoft Excel is based on a grid system of rows and columns. Each cell can contain text, numbers, or formulas. Excel automatically recalculates results when input data changes.
- Data is entered into cells identified by cell addresses such as A1, B2, etc.
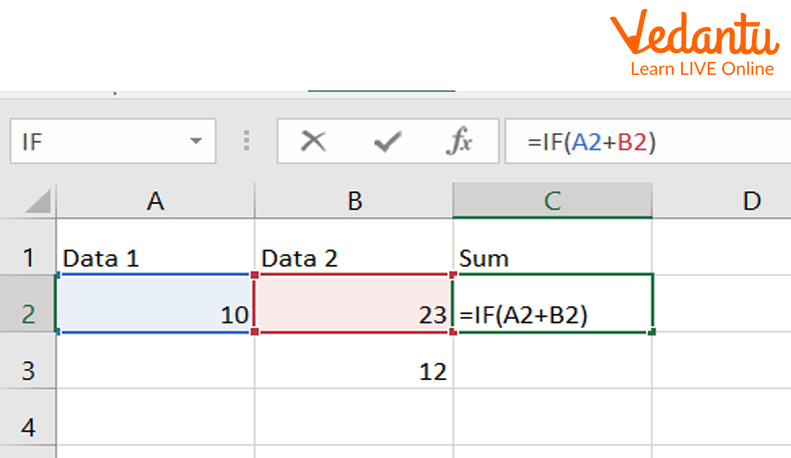
- Formulas are written using arithmetic operators and functions like SUM, AVERAGE, and IF.
- Excel processes the formula and displays the result in the selected cell.
- When values are modified, Excel automatically updates the results.
- Charts and graphs can be generated to visually represent the data.
Types of Cell References in Microsoft Excel
Cell references are used in formulas to refer to data in other cells. There are three main types of cell references in Microsoft Excel.
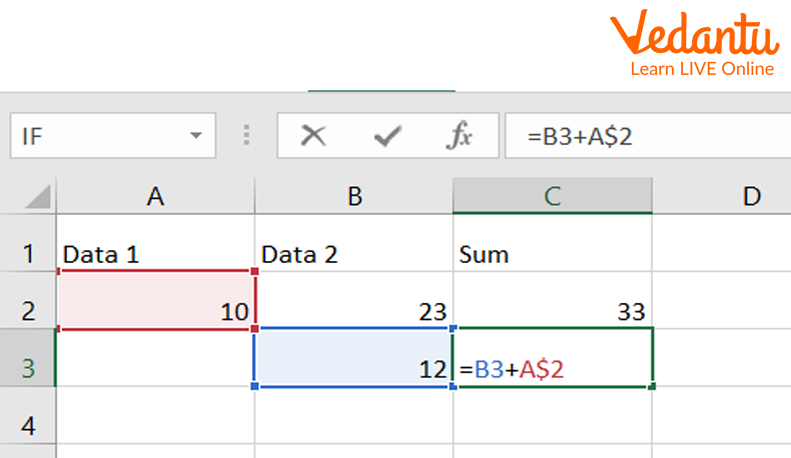
1. Relative Cell Reference
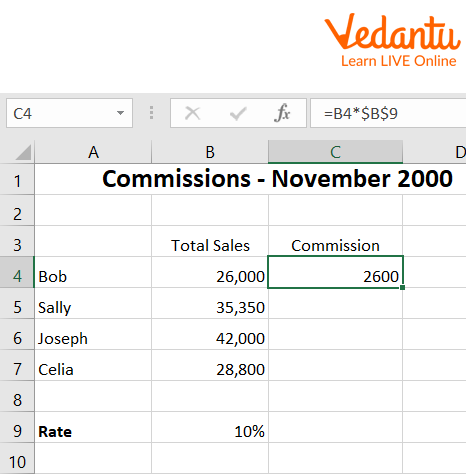
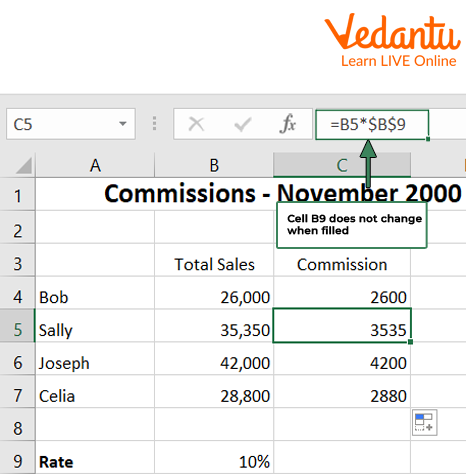
A relative cell reference changes automatically when a formula is copied to another cell.
2. Absolute Cell Reference
An absolute cell reference remains constant when copied to another cell. It uses the dollar symbol before the column and row, such as $A$1.
3. Mixed Cell Reference
A mixed cell reference locks either the row or the column. Examples include $A1 or A$1.
Syntax and Example
Basic Formula Syntax
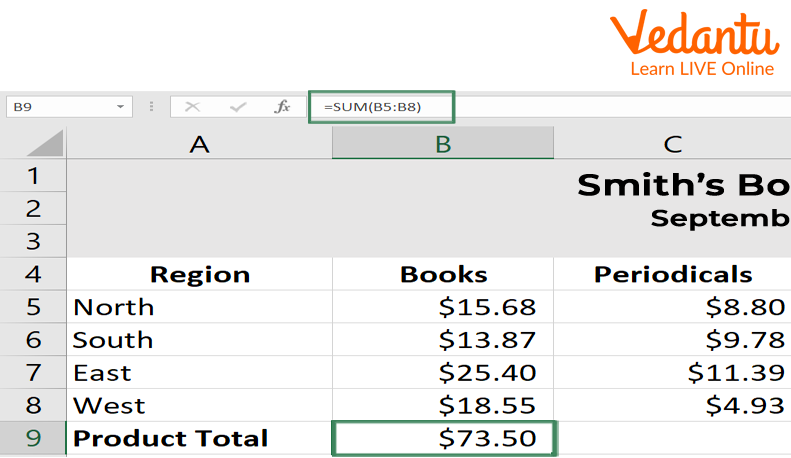
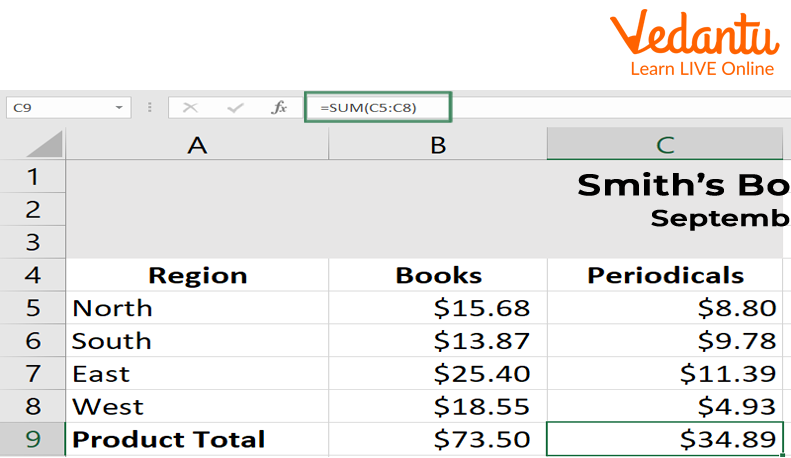
=FUNCTION_NAME(Cell1:Cell2)Example
=SUM(A1:A5)This formula adds the values from cell A1 to A5 and displays the total in the selected cell.
Features and Characteristics
- Supports complex mathematical and logical calculations.
- Provides built in functions such as SUM, IF, VLOOKUP, and COUNT.
- Offers data visualization through charts and graphs.
- Allows sorting and filtering of data.
- Supports data validation and conditional formatting.
- Enables automation using macros and VBA.
Advantages
- Easy to use interface.
- Powerful data analysis tools.
- Widely used in business and education.
- Saves time with automatic calculations.
- Supports integration with other Microsoft Office applications.
Disadvantages / Limitations
- Limited handling of extremely large datasets compared to databases.
- Prone to human errors in formula entry.
- Complex formulas can become difficult to manage.
- Requires licensed software for full features.
Applications and Use Cases
- Financial analysis and budgeting.
- Data analysis and reporting.
- Inventory management.
- Academic record keeping.
- Project management and scheduling.
Quick Facts About Microsoft Excel
| Category | Details | Information |
|---|---|---|
| Developed By | Microsoft | Part of Microsoft Office Suite |
| Initial Release | 1985 | First released for Macintosh |
| File Extension | .xlsx | Spreadsheet file format |
| Used For | Data Analysis | Calculation and Reporting |
Microsoft Excel is widely used across industries for managing structured data efficiently.
Interesting Facts About Microsoft Excel
- Excel can handle more than one million rows in a single worksheet.
- It supports over 400 built in functions.
- Excel includes powerful tools like PivotTables for data summarization.
- It allows automation using Visual Basic for Applications.
- Excel is available on Windows, macOS, and web platforms.
- Conditional formatting helps highlight important data automatically.
Conclusion
Microsoft Excel is an essential tool in computer science and data management. It simplifies complex calculations, organizes large datasets, and supports effective decision making through data visualization and analysis. By understanding Microsoft Excel definition, working, types of cell references, features, and applications, students can build strong analytical and computational skills. Mastering Excel enhances productivity and prepares learners for academic and professional success in a data driven world.
FAQs on Microsoft Excel Complete Guide for Data Analysis and Exams
1. What is Microsoft Excel in Computer Science?
Microsoft Excel is a spreadsheet software developed by Microsoft used for data storage, calculation, analysis, and visualization in Computer Science and business applications.
- Part of Microsoft Office and Microsoft 365
- Works using rows, columns, and cells
- Supports formulas, functions, charts, and data analysis tools
- Widely used in schools, colleges, offices, and competitive exam preparation
2. How does Microsoft Excel work?
Microsoft Excel works by organizing data in a grid of cells where users can enter values, apply formulas, and perform automatic calculations.
- Each cell has a unique address like A1, B2
- Supports mathematical and logical functions such as SUM and IF
- Uses a built-in calculation engine to process data
- Allows data visualization using charts and graphs
3. What are formulas and functions in Microsoft Excel?
In Microsoft Excel, formulas are user-defined expressions, while functions are predefined built-in operations used for calculations.
- Formulas start with the = symbol, for example =A1+A2
- Common functions include SUM(), AVERAGE(), IF(), VLOOKUP()
- Used for data analysis, reporting, and automation
- Important for exams and interview-based problem solving
4. What are the main features of Microsoft Excel?
Microsoft Excel provides powerful data management and analysis features for academic, business, and technical use.
- Spreadsheet interface with rows and columns
- Charts and data visualization tools
- Pivot Tables for summarizing large datasets
- Sorting and filtering options
- Macros and VBA for automation
5. What are the components of the Microsoft Excel interface?
The Microsoft Excel interface consists of several GUI components that help users manage spreadsheets efficiently.
- Ribbon containing tabs and commands
- Worksheet area with cells
- Formula Bar to edit data and formulas
- Name Box showing cell reference
- Status Bar displaying calculation results
6. What are the types of data in Microsoft Excel?
Microsoft Excel supports different data types to perform structured data processing and analysis.
- Text (Label) for names and descriptions
- Number for calculations
- Date and Time values
- Boolean values TRUE or FALSE
- Currency and Percentage formats
7. What are the advantages and disadvantages of Microsoft Excel?
Microsoft Excel offers flexible data analysis capabilities but has limitations when handling extremely large or complex systems.
- Advantages: easy to use, powerful functions, data visualization, automation using VBA
- Disadvantages: limited scalability compared to databases, risk of manual errors, performance issues with very large datasets
- Not a replacement for full-scale database management systems like MySQL or Oracle
8. What is the difference between Microsoft Excel and a Database Management System (DBMS)?
Microsoft Excel is a spreadsheet application for data analysis, while a DBMS is designed for structured data storage, management, and multi-user access.
- Excel is suitable for small to medium datasets
- DBMS supports SQL queries and relational models
- DBMS provides better data integrity and security
- Excel is commonly used for reporting and visualization
9. What are Pivot Tables in Microsoft Excel?
A Pivot Table in Microsoft Excel is a data analysis tool used to summarize, group, and aggregate large datasets quickly.
- Performs operations like sum, count, average
- Allows dynamic filtering and sorting
- Useful for business intelligence and reporting
- Important topic for exams and job interviews
10. What are the applications and real-world uses of Microsoft Excel?
Microsoft Excel is widely used for data analysis, financial modeling, reporting, and academic projects across industries.
- Budget planning and accounting
- Data analysis in research and statistics
- Project management and scheduling
- Creating dashboards using charts and Pivot Tables
- Exam preparation for Computer Science and IT subjects