


Introduction to Micro Economics Class 12 important questions with answers PDF download
Free PDF download of Important Questions with Answers for CBSE Class 12 Micro Economics Chapter 1 - Introduction to Micro Economics prepared by expert Economics teachers from latest edition of CBSE(NCERT) books. Register for Online tuition on Vedantu.com to score more marks in CBSE board examination.
 Table of Content
Multiple choice and Very Short Answer Questions (1 Mark)
1. Which of the following is a statement of normative nature in economics?
(a) Economics is the study of choices/alternatives.
(b) Government should be concerned with how to reduce unemployment
(c) According to an estimate, in spite of severe shortage, more than 10% of houses in Indian cities are lying vacant.
(d) Accommodation of Refugees is posing a big problem for the Europe
Ans: (a) Economics is the study of choices/alternatives.
2. Define scarcity.
Ans: Scarcity refers to a lack of resources in relation to their demand.
3. A growth of resources in an economy is shown on PPC by:
(a) Leftward Shift
(b) Unchanged PPC
(c) Rightward Shift
(d) None of the above
Ans: (c) Rightward Shift
4. Name the three central problems of an economy.
Ans: The three central problems are:
What should be produced?
How to produce?
For whom should the product be produced?
5. What is meant by economising of resources?
Ans: Economising of resources means making the best use of the existing resources.
6. Define Normative Economics with a suitable example.
Ans: Normative economics is a branch of economics that studies how an economy should function under ideal conditions. It focuses on the ‘what oughtt to be’ aspect. For example, subsidies should be provided to farmers etc.
7. Give two examples each of micro and macroeconomics.
Ans: Individual demand and supply are two instances of microeconomics. Whereas, examples of macroeconomics include aggregate demand and aggregate supply.
8. What does a point inside the PPC indicate?
Ans: A point inside the PPC (Production Possibility Curve) indicates resource underutilization.
9. Define marginal rate of transformation.
Ans: MRT (Marginal Rate of Transformation) is the ratio of units of one good that are sacrificed in order to create one more unit of another goods.
10. What is the opportunity cost?
Ans: It is the expense of foregoing the next best alternative.
11. The basic assumption regarding resources while drawing a PPC is
(a) Resources are unlimited
(b) Resources depend on the kind of goods produced
(c) Resources can be put to a particular use
(d) Resources are constant and given
Ans: (d) Resources are constant and given
12. What is the other name for opportunity cost in economics?
(a) Economic problem
(b) Marginal cost
(c) Total Cost
(d) Economic cost
Ans: (d) Economic cost
13. In a centrally planned economy, the central problems are solved by
(a) Supply of goods
(b) Demand for goods
(c) Market mechanism
(d) Planning authority
Ans: (d) Planning authority
14. In a market economy, the central problems are solved by
(a) Demand for goods
(b) Supply of goods
(c) Planning authority
(d) Market mechanism
Ans: (d) ) Market mechanism
15. The study of the jute industry is a macroeconomic study. This statement is
(a) Conditional
(b) True
(c) Can’t say
(d) False
Ans: (d) False
Short Answer Questions (3 or 4 Marks)
16. Does massive unemployment shift the PPC to the left?
Ans: Massive unemployment is caused by inefficient resource use, which does not reduce the economy's capacity to produce. As a result, there will be no shift in PPC. Due to resource underutilization, the economy will operate within the PPC.
17. From the following PP schedule calculate MRT of good x.
Ans: The MRT calculations are:
18. What does the problem for whom to produce refer to?
Ans: The issue for whom to produce refers to the selection of the people who will ultimately consume the goods. Because resources are limited in every economy, no society can meet all of its citizens' desires.
As a result, a choice problem arises. The economic problem of "For Whom to Produce?" is essentially concerned with the distribution mix of the final goods and services produced.
The distribution of final goods and services is analogous to the distribution of national income (or national product) among production factors such as land, labor, capital, and entrepreneur
The issue can be divided into two categories:
Personal distribution: This refers to how an economy's national income is distributed among different groups of people.
Functional Distribution: This entails determining the proportion of various production factors in the country's total national product.
19. What is the opportunity cost? Explain with the help of a numerical example.
Ans: The gains that an individual, investor, or corporation foregoes while choosing one alternative over another are referred to as opportunity costs. The opportunity cost, also known as alternative cost in microeconomic theory, is the value (not a benefit) of the best alternative while making a decision.
Amrita, for example, has three employment offers from which to choose. Job A pays Rs. 60000, Job B pays Rs. 70000, and Job C pays Rs. 80000. If she took Job C, the opportunity cost would be Rs. 70000 per month.
20. Why is a Production Possibility Curve (PPC) concave? Explain.
Ans: Production Possibility Curve (PPC) is concave to the origin because each additional unit of good X necessitates the sacrifice of more and more units of good Y. In terms of the loss of production of good Y, the opportunity cost of producing each additional unit of good X tends to rise. This is due to the fact that production factors are not perfect substitutes for one another.
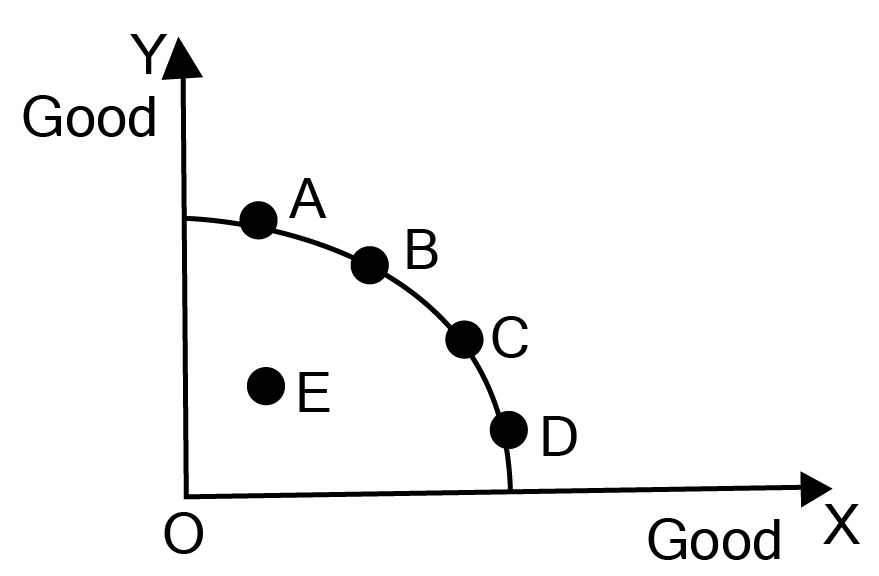
In the diagram, there are different combinations of good X and good Y, that is combination A,B,C and D which could be produced when the the resources in the economy are optimally and fully utilised. Any point on or below the production possibility frontier gives a combination of goods that could be produced given the resources and technology, however any combination under the PPC (Point E) signifies the underutilization or wasteful utilisation of resources.
Long Answer Questions (6 Marks)
21. What is the production possibility frontier?
Ans: Production possibility frontier:
The production possibility frontier is a curve that depicts all possible combinations of two goods that can be produced in a given economy with given resources and technology.
The production possibility frontier is also known as the transformation curve or the production possibility curve.
Due to scarce and finite resources, the production of a commodity could only be increased if there is a reduction in the other commodity. Hence, the PPC curve is concave.
Assumptions
The PP curve concept is founded on the following assumptions:
The economy's resource base is fixed.
The technology is pre-installed and unmodified.
The resources are effective and fully utilised.
In the production of all goods, all resources are not equally efficient.
Diagram:
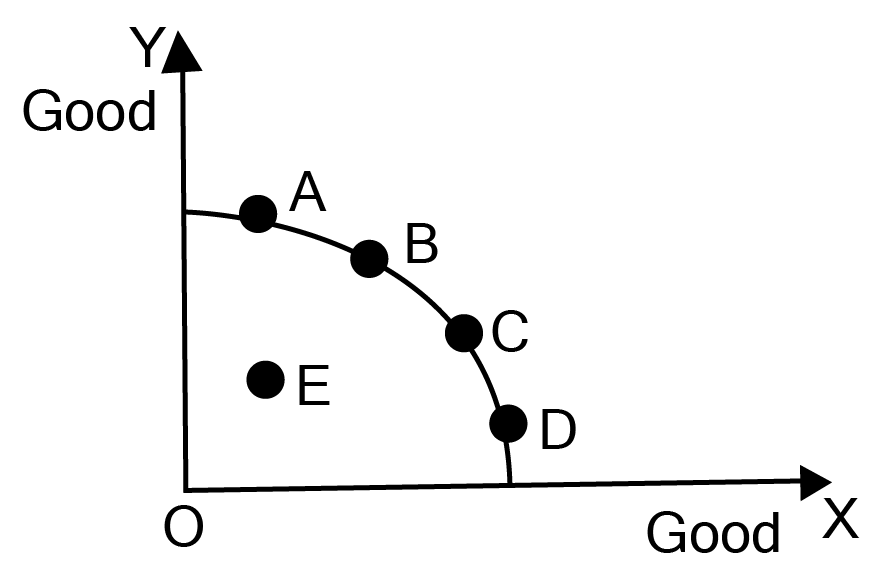
In the diagram, there are different combinations of good X and good Y, that is combination A,B,C and D which could be produced when the the resources in the economy are optimally and fully utilised. Any point on or below the production possibility frontier gives a combination of goods that could be produced given the resources and technology, however any combination under the PPC (Point E) signifies the underutilization or wasteful utilisation of resources.
Shifts in Production Possibility Curve.
Reasons:
Changes in resources.
Changes in manufacturing technology for both goods.
Rightward shift:
Production Possibility Curve shift to the right indicates an increase in resources or technological advancement. Example skilled labour, technological advancements, and increased land productivity are all factors that are contributing to increased productivity.
Leftward shift:
Production Possibility Curve shift to the left indicates a decrease in resources or a deterioration in technology in the economy. Example unskilled labour, technological obsolescence, and decreased land productivity are all factors that are contributing to decreased productivity.
22. Draw a production possibility curve and mark the following situations.
a. Underutilization of resources
b. Full employment of resources
c. Growth of resources
Ans: Before the diagram, the explanations are:
a. Underutilization of resources : Underutilization of resources refers to a situation in which resources are used inefficiently during the production process. A point located below the production possibility curve indicates underutilization or inefficient resource utilization. The actual output is less than the potential output in this case. The examples of underutilization are shown below.
Labor illiteracy
Inefficient or partial utilization of resources such as machines
b. Full employment of resources:
Full employment refers to an economic situation in which all available labor resources are used as efficiently as possible. Full employment represents the maximum amount of skilled and unskilled labor that an economy can employ at any given time.
c. Growth of resources : Growth is defined as an increase in an economy's output over a period of time, with a minimum of two consecutive quarters.
The second definition of economic growth is an increase in what an economy can produce if all of its scarce resources are used. An increase in an economy's productive potential can be demonstrated by an outward shift in the production possibility frontier of the economy (PPF).
Production possibility curve depicting all the above situations:
It refers to a curve that depicts the many production possibilities that can be realized with the available resources and technology.
In the diagram given below:
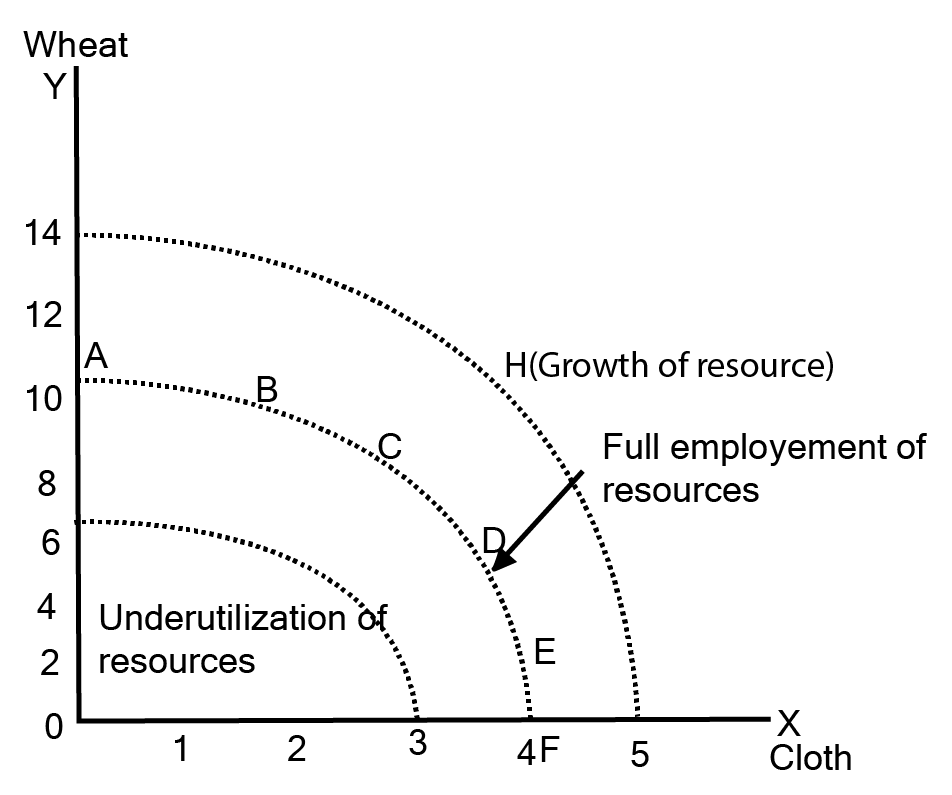
Every point on the PP curve, such as ABCDEF, denotes full employment of resources and efficient resource usage.
Any point below or inside the PP curve, such as G, indicates underutilization of resources.
Any point above PP curves such as H shows growth of resources.
If the economy commits all of its resources to the production of commodity wheat, it can generate 14 units, but commodity cloth’s output will be zero. Commodity cloth and wheat may have a variety of production options. If we wish to increase the output of cloth , we must reduce the output of commodity wheat, and vice versa.
23. What is the difference between a planned economy and market economy?
Ans: The difference between a planned economy and market economy is as follows:
24. Explain the central problem of the choice of products to be produced.
Ans: What to produce:
This problem involves two issues, mainly:
The choice regarding the choice of products.
The quantity of the chosen product.
Since there is a choice problem, the economy must decide which goods and services to produce, as the resources are limited and scarce in an economy, hence an optimum decision needs to be taken in respect to the choice as well the quantities of goods and services. The problem of choice mainly exists between consumer goods and capital goods.
For example, which consumer goods, such as wheat, rice, and cloth, and which capital goods, such as machines and tools, are to be produced.
When an economy decides what goods or services to produce, it must also decide on their quantity. Hence, it is not about choosing to produce either of the two, it is about deciding the quantity of each of them. If a decision is taken regarding more production of consumer goods, then it will have an impact on the quality of life of the current generation, whereas if capital goods are produced in more quantity, it will impact the production capacities of the future. Hence a decision needs to be made that takes into consideration both the present and the future generations.
Important Study Material Links for Class 12 Microeconomics Chapter 1
CBSE Class 12 Economics Important Questions Textbooks
Chapter-wise Links for Microeconomics Class 12 Questions
Related Study Materials Links for Class 12 Microeconomics
Along with this, students can also download additional study materials provided by Vedantu for Microeconomics Class 12–


FAQs on Important Questions For Class 12 Micro Economics Chapter 1 Introduction to Micro Economics - 2026-27
1. What are the most important questions from Chapter 1, Introduction to Microeconomics, for the CBSE Class 12 Board Exam 2026-27?
For the CBSE 2026-27 board exams, the most important questions from this chapter focus on fundamental concepts. Students should prioritise:
- The three central problems of an economy: 'What', 'How', and 'For whom' to produce (often asked for 3-4 marks).
- Production Possibility Curve (PPC): Its properties, shifts, and rotation. Questions on why it is concave are very common (4-6 marks).
- Opportunity Cost: Its definition and calculation, often explained with a numerical example (1-3 marks).
- Difference between Microeconomics and Macroeconomics: A classic distinction question (3-4 marks).
- Positive vs. Normative Economics: Understanding the difference with examples (1-3 marks).
2. Explain the three central problems of an economy: 'What to produce?', 'How to produce?', and 'For whom to produce?'.
Every economy faces three fundamental or central problems due to the scarcity of resources:
- What to produce and in what quantities?: This involves choosing which goods and services to produce (e.g., consumer goods like rice and wheat vs. capital goods like machinery) and deciding the quantity of each.
- How to produce?: This refers to selecting the technique of production. An economy must choose between labour-intensive techniques (using more labour) and capital-intensive techniques (using more machinery).
- For whom to produce?: This problem is about the distribution of the produced goods and services among the population. It deals with how the national product is shared among different households.
3. Why is the Production Possibility Curve (PPC) concave to the origin? What economic principle does this illustrate?
The Production Possibility Curve (PPC) is concave to the origin because of the increasing Marginal Rate of Transformation (MRT), which in turn is based on the principle of increasing opportunity cost. This happens because resources are not equally efficient in the production of all goods. To produce more of one good (Good X), more and more units of the other good (Good Y) have to be sacrificed. This is because resources that are best suited for producing Good Y are gradually transferred to produce Good X, leading to a fall in their productivity.
4. How would you distinguish between a centrally planned economy and a market economy for a board exam answer?
To distinguish between a centrally planned economy and a market economy, you should focus on these key points:
- Ownership of Resources: In a planned economy, resources are owned by the state or a central authority. In a market economy, resources are primarily owned by private individuals.
- Economic Decisions: In a planned economy, all key economic decisions are made by the government or a central planning authority. In a market economy, decisions are driven by the market forces of demand and supply.
- Primary Motive: The main objective of a planned economy is social welfare. For a market economy, the primary motive is profit maximization.
- Consumer's Role: The consumer is not sovereign in a planned economy. In a market economy, the consumer is considered sovereign, as production is guided by consumer preferences.
5. What is 'opportunity cost'? Explain this concept with a suitable numerical example.
Opportunity cost is the value of the next-best alternative that must be forgone to pursue a certain action. It is the cost of the missed opportunity.
Example: Suppose a person has three job offers: Job A with a salary of ₹50,000, Job B with a salary of ₹60,000, and Job C with a salary of ₹70,000. If the person chooses Job C (the highest salary), the opportunity cost is the value of the next-best alternative, which is the salary from Job B. Therefore, the opportunity cost of accepting Job C is ₹60,000.
6. How does a Production Possibility Curve (PPC) illustrate the concepts of scarcity, resource underutilisation, and economic growth?
A PPC is an excellent tool to illustrate core economic concepts:
- Scarcity: The PPC itself, which is a boundary, represents the limit of what can be produced with available resources. Any point beyond the curve is unattainable, thus depicting the problem of scarcity.
- Resource Underutilisation: Any point inside the PPC signifies that resources are not being used efficiently or are unemployed. At such a point, the economy can increase the production of one or both goods with existing resources.
- Economic Growth: A rightward shift of the entire PPC indicates economic growth. This happens due to an increase in resources (like more labour or capital) or an improvement in technology, allowing the economy to produce more of both goods.
7. Does large-scale unemployment cause the PPC to shift inwards? Explain this common point of confusion.
No, large-scale unemployment does not cause the PPC to shift inwards. This is a common misconception. The PPC represents the potential output of an economy if all resources are fully and efficiently employed. Unemployment signifies that the existing resources are being underutilised. Therefore, unemployment would be represented by a point inside the PPC, not a shift of the curve itself. A leftward shift only occurs if the economy's actual productive capacity decreases, for example, due to a natural disaster or degradation of technology.
8. Explain the difference between positive economics and normative economics with examples relevant to CBSE Class 12.
The key difference lies in their approach to economic issues:
- Positive Economics deals with what is, what was, or what will be. It describes economic phenomena as they are, based on facts and data. These statements are verifiable. For example, "The inflation rate in India is 6%."
- Normative Economics deals with what ought to be. It involves value judgements and opinions on how the economy should work. These statements are not verifiable. For example, "The government should implement policies to reduce inflation below 4%."
This distinction is crucial for evaluating economic policies objectively versus subjectively.
9. What is the significance of the Marginal Rate of Transformation (MRT) in the context of the CBSE board exam?
The Marginal Rate of Transformation (MRT) is significant because it represents the slope of the PPC and quantifies opportunity cost. For board exams, its importance is:
- It is the rate at which an economy must give up units of one good to produce one additional unit of another good, assuming full resource utilisation.
- An increasing MRT is the reason for the concave shape of the PPC, a frequently asked question.
- In exams, MRT is often tested through numerical problems where students must calculate it from a production schedule, or through diagram-based questions requiring an explanation of the PPC's slope.
10. What are some common mistakes to avoid when answering diagram-based questions about the PPC in the board exam?
To score full marks in PPC-related diagram questions, students must avoid these common errors:
- Incorrect Labelling: Forgetting to label the X-axis, Y-axis, the goods being produced, and the curve itself (PPC).
- Wrong Shape: Drawing the PPC as a straight line or convex, instead of its correct concave shape to the origin.
- Confusing a Shift with Movement: A movement along the curve shows a reallocation of resources between two goods. A shift of the entire curve shows a change in productive capacity (growth or decline). Confusing these is a major conceptual error.
- Improperly Marking Points: Not clearly marking points representing underutilisation (inside the curve), full utilisation (on the curve), and unattainable combinations (outside the curve).