


How to Read and Answer Questions on Bar Graphs and Pictographs for Grade 3
Section 1: Reading a Pictograph
Riya recorded the favorite playground activities of her friends. Look at the pictograph below and answer the questions that follow.
Favorite Playground Activities
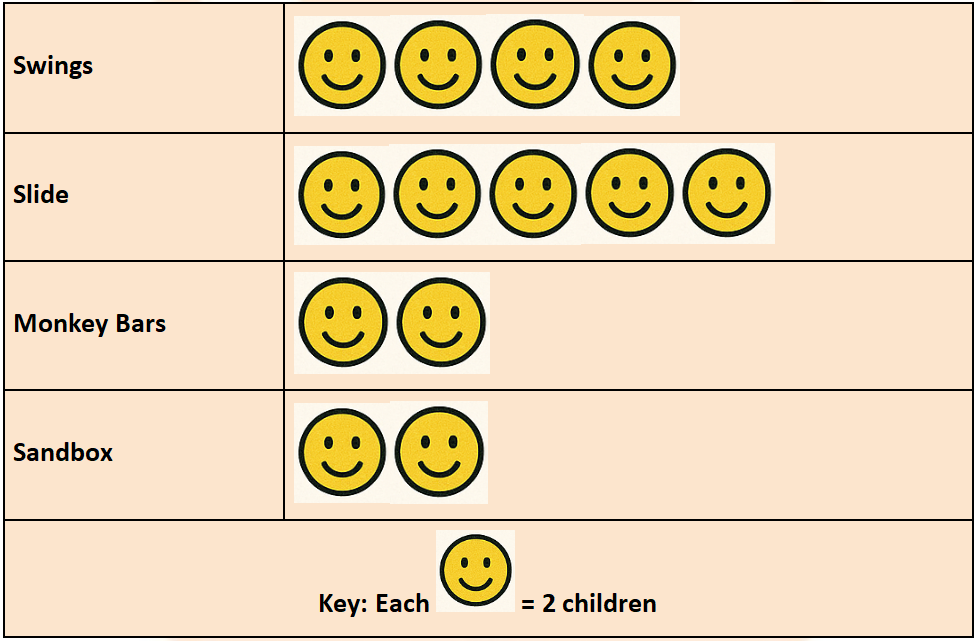
1. How many children chose the slide as their favorite activity?
____________________________________________________________
2. Which activity is the least popular among the children?
____________________________________________________________
3. How many more children prefer the swings over the sandbox?
____________________________________________________________
4. What is the total number of children who participated in this survey?
____________________________________________________________
5. True or False: The number of children who like the slide is exactly double the number of children who like the monkey bars.
____________________________________________________________
Section 2: Interpreting a Bar Graph
The bar graph below shows the number of books read by four students in a month.
Books Read in a Month
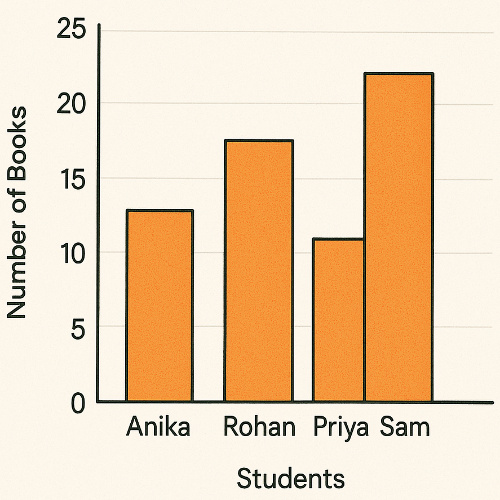
6. Who read the most number of books?
____________________________________________________________
7. How many books did Anika and Priya read altogether?
____________________________________________________________
8. Fill in the blank: Rohan read _________ more books than Priya.
____________________________________________________________
9. Tick the correct statement:
a) Anika read fewer books than Priya. ( )
b) Sam read the least number of books. ( )
c) Rohan read exactly 18 books. ( )
Section 3: Tally Charts
A class teacher conducted a survey to find the favorite ice cream flavors of the students. The results are shown in the tally chart below. Complete the table by writing the frequency (number) and then answer the questions.
10. First, fill in the 'Frequency' column in the table above.
11. Which flavor is the most favorite among the students?
____________________________________________________________
12. How many students chose Vanilla as their favorite flavor?
____________________________________________________________
13. How many students participated in the survey in total?
____________________________________________________________
Section 4: Create a Bar Graph
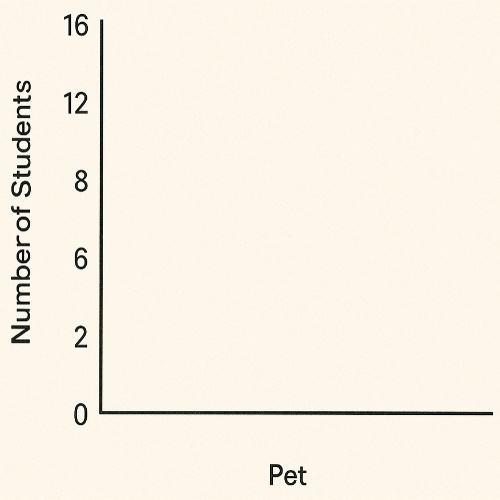
The table below shows the number of different pets owned by the students of Class 3. Use this data to create a bar graph in the space provided.
14. Draw a bar graph to represent the data. Remember to label the axes and give your graph a title.
Section 5: Multiple Choice Questions (MCQs)
15. A pictograph uses _________ to represent data.
a) Bars
b) Lines
c) Pictures or symbols
d) Numbers
16. In a tally chart, the symbol '||||' represents the number:
a) 5
b) 4
c) 6
d) 3
17. If one star (⭐) represents 5 cars, how many cars do three stars (⭐⭐⭐) represent?
a) 5
b) 10
c) 3
d) 15
Answer Key
1. 10 children (5 symbols x 2 children per symbol)
2. Monkey Bars (4 children)
3. 2 more children (Swings have 8, Sandbox has 6. 8 - 6 = 2)
4. 28 children (8 + 10 + 4 + 6 = 28)
5. False (Slide has 10, Monkey Bars has 4. 10 is not double of 4.)
6. Sam
7. 24 books (13 + 11 = 24)
8. 7 (18-11=7)
9. c) Rohan read exactly 18 books. (✓)
10. The 'Frequency' column should be filled as: Chocolate - 12, Vanilla - 6, Strawberry - 8, Mango - 9.
11. Chocolate
12. 6 students
13. 35 students (12 + 6 + 8 + 9 = 35)
14. The bar graph should have the title "Pets Owned by Students". The X-axis should be labeled "Pet" with bars for Dog, Cat, Fish, and Hamster. The Y-axis should be "Number of Students". The bars should be drawn to the correct heights: Dog bar to 12, Cat bar to 8, Fish bar to 14, and Hamster bar to 4.
15. c) Pictures or symbols
16. b) 4
17. d) 15
Data Graphing in Maths – Class 3 Worksheet with Practice Questions
In this Class 3 Maths worksheet, students discover how to read and create simple bar graphs and pictographs. They learn to organize data, spot patterns, and answer questions using graphs.
Practicing data graphing helps build confidence for real-life problem-solving in the Mathematics subject. Kids use their observation skills and understand data handling, making Maths more interesting and easier to apply every day.
Making Maths Easy with Colourful Data Graphs
Through the Data Graphing topic in Class 3 Mathematics, students practice turning numbers into easy-to-read graphs. This worksheet guides learners to collect data and compare information quickly.
Children see how graphing helps solve homework questions, understand surveys, and make choices at school. Data graphing questions are both fun and useful, helping kids prepare for Maths exams and improve their reasoning skills.
FAQs on Data Graphing and Data Handling Practice for Class 3
1. What is data handling for class 3?
Data handling for class 3 is the process of collecting, organizing, and representing information using visuals like tally charts, bar graphs, and pictographs. Students learn to read, compare, and interpret real-life data, strengthening their numeracy skills through engaging maths worksheets and classroom activities.
2. What is a pictograph with example?
A pictograph is a visual way to represent data using pictures or symbols. For example, if each 🏀 stands for 2 basketballs, seeing 4 🏀 symbols on a chart means there are 8 basketballs. Pictographs help students quickly compare and understand quantities in a fun, visual format.
3. How to read a bar graph in class 3?
To read a bar graph in class 3, start by checking what each bar represents and look at the numbers (scale) along the side. Then:
- Identify each category on the graph
- See how tall each bar is
- Match the bar's height to the number it shows
- Use this information to answer questions and compare data easily
4. Difference between tally chart and bar graph?
A tally chart uses marks to count and group data, while a bar graph uses bars of different heights to show totals for each group. Tally charts help in collecting data quickly, and bar graphs make it easy to compare quantities at a glance.
5. How do you draw a simple pictograph?
To draw a simple pictograph:
- Make a table with categories
- Choose a symbol (e.g., 🍎 or ★) and decide what number each stands for
- Draw the correct number of symbols for each category
- Add a key to explain the meaning of each symbol.
This method makes data fun and easy to read for Class 3 students.
6. How can I use this worksheet at home?
You can use this Class 3 Maths Data Graphing worksheet at home by printing it and letting children solve the bar graph, pictograph, and tally chart questions independently or with guidance. This boosts data interpretation and problem-solving skills for homework or revision.
7. Does this include an answer key?
Yes, the downloadable data handling worksheet includes an answer key. This helps parents and teachers review solutions and guide students in understanding where they made mistakes or did well.
8. Is this worksheet printable?
Yes, the Class 3 Maths Data Graphing worksheet is printable and available as a free PDF download. You can print it for classroom, homework, or holiday use.
9. What age group is it best for?
This data handling worksheet is best suited for Grade 3/Class 3 students (usually ages 7–9). It aligns with their syllabus and builds essential maths skills for their academic level.
10. What skills are built by this activity?
This activity helps students:
- Analyze and interpret data
- Build problem-solving and visual learning skills
- Practice categorizing and comparing information
- Strengthen numeracy through real-life graphing tasks
11. Can I use this worksheet digitally on a tablet?
Yes, you can open and use the downloadable data handling worksheet as a PDF on a tablet. Many students complete activities by writing on the screen using a stylus or built-in PDF editor apps.
12. Can I modify or combine this with other worksheets?
Yes, you can combine or modify this class 3 data handling worksheet with other maths practice sheets. Adjusting activities or merging with addition, place value, or measurement tasks helps reinforce multiple maths concepts.