


How to Read and Draw Bar Graphs and Pictographs in Grade 2
Section 1: The Toy Box Pictograph
Look at the pictograph below. It shows the number of toys in Rohan's toy box. Answer the questions that follow.
1. How many balls are in the toy box?
____________________
2. Which toy does Rohan have the most of?
____________________
3. Which toy does Rohan have the least of?
____________________
4. How many cars and dolls are there in total?
____________________
5. Are there more blocks than cars? (Yes/No)
____________________
6. How many toys are there in all?
____________________
Section 2: Favorite Ice Cream Flavors
The bar graph shows the favorite ice cream flavors of the students in Class 2. Use the graph to answer the questions.
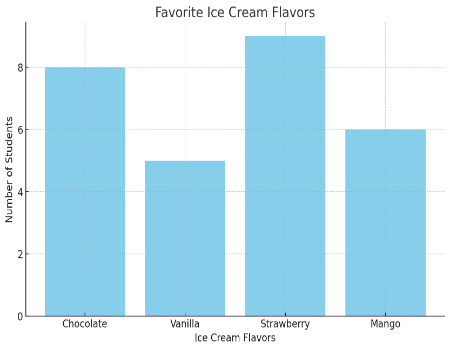
7. Which ice cream flavor is the most popular?
____________________
8. How many students chose Vanilla?
____________________
9. How many more students like Strawberry than Mango?
____________________
10. Complete the sentence: The least popular ice cream flavor is __________.
11. Tick the correct statement.
( ) More students like Mango than Chocolate.
( ) Fewer students like Vanilla than Mango.
( ) Chocolate is as popular as Strawberry.
Section 3: Animals on the Farm
A farmer counted the animals on his farm. He made a tally chart. First, write the total number for each animal. Then, answer the questions.
12. Fill in the 'Number' column in the table above.
13. How many chickens are on the farm?
____________________
14. Which animal is the most numerous on the farm?
____________________
15. How many cows and pigs are there altogether?
____________________
16. There are fewer sheep than cows. (True / False)
____________________
Answer Key
1. 7
2. Balls
3. Dolls
4. 9
5. Yes
6. 22
7. Strawberry
8. 5
9. 3
10. Vanilla
11. The second statement should be ticked: (✓) Fewer students like Vanilla than Mango.
12. Table numbers: Cows - 11, Chickens - 17, Pigs - 7, Sheep - 9.
13. 17
14. Chickens
15. 18
16. False
How This Worksheet Helps You Learn?
Class 2 Maths Data Graphing worksheets help young learners build key skills in collecting, reading, and interpreting data through simple graphs. These printable worksheets are designed to introduce children to bar graphs, pictographs, and tally charts using age-appropriate activities. As a PDF practice sheet for Grade 2, these exercises make learning math visual, engaging, and effective for both classroom and home use. Regular practice with data handling for class 2 not only supports logical thinking but also makes maths fun and meaningful for every student.
How to Use This Worksheet Effectively
- Begin each session by reviewing sample questions, then let your child try reading and making graphs independently.
- Encourage hands-on practice by helping children draw their own pictographs or bar graphs from simple class data.
- Use the worksheet as a printable homework sheet to reinforce concepts learned during lessons.
- Review answers together, discussing how information changes when displayed in different types of charts.
Explore More Related Worksheets
- Class 2 Maths Bar Graphs Worksheets
- Class 2 Maths Pictograph Worksheets
- Missing Number Worksheet for Class 2
- Place Value Worksheets
- Count and Write Worksheets
- 3rd Grade Data Handling Worksheets
What You Learned
On this page, you explored how Class 2 Maths Data Graphing worksheets introduce important concepts like data handling, bar graphs, pictographs, and tally charts. These printable worksheets and PDF sheets provide structured practice for Grade 2 students, helping strengthen their observational and reasoning skills through engaging tasks. With clear, simple instructions and step-by-step activities, these resources make it easy for kids to understand and enjoy basic data interpretation in maths.
FAQs on Data Graphing Worksheets for Class 2 Maths Practice
1. What is data handling for class 2?
Data handling for Class 2 is the process of collecting, organizing, and understanding information using simple visual tools. It helps young learners make sense of data from their surroundings by practising skills like:
- Collecting data: Gathering information, such as counting the number of different coloured toys.
- Organizing data: Arranging the collected information in tally charts or tables.
- Representing data: Creating visual charts like pictographs and simple bar graphs.
- Interpreting data: Answering questions by reading the information presented in the graphs.
2. How do you teach graphing to second graders?
You can effectively teach graphing to second graders by making the process interactive and connecting it to their everyday experiences. A great way to start is by using a data graphing worksheet for grade 2, which typically follows these steps:
- Start with a simple question, like “What is our class's favourite fruit?”.
- Guide them to collect data from their classmates.
- Show them how to record this information using a tally chart.
- Introduce a pictograph, where one picture represents one or more items.
- Finally, help them create a simple bar graph to compare the numbers visually.
3. What is a pictograph for kids?
A pictograph is a type of graph that uses pictures or symbols to represent data, making it very easy for kids to understand. In a pictograph worksheet for grade 2, students learn that each picture stands for a certain number of items, which is explained in a 'key'. For example, one star symbol (⭐️) might represent 2 students.
4. How do you make a simple bar graph for class 2?
Making a simple bar graph for Class 2 involves a few easy steps that help visualize numbers clearly. To create one, you should:
- Collect Data: First, gather your information, often using a tally chart.
- Draw Axes: Draw a horizontal line (x-axis) and a vertical line (y-axis).
- Label Categories: Write the names of the items you are comparing along the horizontal axis (e.g., 'Apples', 'Bananas').
- Label Numbers: Write numbers on the vertical axis to show the count (e.g., 0, 1, 2, 3).
- Draw Bars: For each item, draw a rectangular bar up to the number that shows how many there are.
5. What skills do data graphing worksheets improve?
Data graphing worksheets for second grade are designed to build several important foundational skills in young learners. These activities go beyond basic math and help improve:
- Observation Skills: Carefully looking at data and graphs to find information.
- Counting and Sorting: Accurately counting items and grouping them into categories.
- Logical Reasoning: Using the graph to answer questions like 'which is most popular?' or 'how many more?'.
- Data Interpretation: Understanding what the information presented in a graph actually means.
- Visual Learning: Strengthening the ability to process and understand information presented visually.
6. Are these Class 2 Maths Data Graphing worksheets printable?
Yes, all our Class 2 Maths worksheets on data graphing are designed to be easily printable. Each worksheet is available as a high-quality, downloadable PDF file, making it simple for parents and teachers to print them for practice at home or in the classroom.
7. Do these graphing worksheets for second grade include an answer key?
Yes, many of our graphing worksheets for second grade come with a corresponding answer key. The answer key allows parents and educators to quickly check a child's work, identify any mistakes, and provide clear explanations, which is a great tool for homework help and revision.
8. What types of questions are in a Class 2 data graphing worksheet?
A typical Class 2 data graphing worksheet includes a variety of questions to build comprehensive skills. Students will be asked to:
- Read a graph: Find specific information directly from a pictograph or bar graph.
- Compare data: Answer questions such as 'Which item is the most?' or 'Which is the least?'.
- Calculate totals: Find the total number of items shown in the graph.
- Draw a graph: Create their own simple bar graph or pictograph based on a given set of data in a table.
9. How does a tally chart help in data handling for Grade 2?
A tally chart is a fundamental tool in data handling for Grade 2 because it provides a quick and organized way to count and record data. It uses simple vertical lines ('tally marks') to represent each item counted. For easier counting, the marks are grouped in sets of five, which helps students avoid errors and prepares them to easily transfer the totals to a bar graph or pictograph.
10. Can I use this worksheet digitally on a tablet?
Yes, you can use these worksheets digitally on a tablet. Since each data graphing worksheet is provided as a PDF, you can download it and open it in any PDF viewer or annotation app on your tablet. This allows students to complete the exercises by drawing or typing directly on the screen, offering a paper-free practice option.