


 Watch Video




Class 9 Maths Chapter 7 Exercise 7.2 Solutions
The NCERT Solutions for Class 9 Maths Chapter 7 Exercise 7.2 provide detailed, step-by-step answers to help students master the exercise. With simple explanations and the correct solving methods, these Class 9 Maths Ex 7.2 solutions make practice and revision more effective.
 Table of Content
Students can use them to understand difficult steps, verify their answers, and strengthen their exam preparation. Explore NCERT Solutions for Class 9 Maths for solutions to all chapters and exercises.


NCERT Solutions for Class 9 Maths Chapter 7 The Mathematics of Maybe: Introduction to Probability Exercise 7.2 | 2026-27


 ShareShare
Think and Reflect
Question 1.
If I roll a 4 on a die 8 times in succession, the probability of rolling a 4 again is still only ~0.16 (assuming the die is fair). Probability doesn't tell you what will happen next; it predicts what will happen in the long run.
Solution:
Even if we roll eight 4s in a row, the probability of rolling another 4 on the 9th try is still 1/6 (approx. 0.16)
Here is why:
Each roll is an independent event. The die doesn’t remember previous results. The conditions remain the same every time.
Sample Space (S) = {1, 2, 3, 4, 5, 6}, i.e., 6 outcomes
Favourable Outcome = {4}, i.e., 1 outcome
Probability: P(4) = 1/6 ~ 0.16
This does not change, no matter how many times we roll.
The gambler’s fallacy is the false belief that a streak must end.
The myth: “A 4 is overdue to stop.”
The reality: The probability is still 1/6
Short run: Streaks like repeated 4s can happen randomly.
Long run: Over many trials, each number appears about 1/6 of the time.
Conclusion: Each roll is independent, so the probability of getting a 4 remains 1/6 .
Question 1.
A teacher mixes a large bag of sweets of different colours and randomly selects a sample of 30 sweets. She counts the number of sweets of each colour:
10 red sweets | 8 green sweets | 7 yellow sweets | 5 blue sweets
(i) Calculate the probability that a randomly picked sweet from the sample is green.
(ii) If there are 600 sweets in total in the large bag, estimate how many are likely to be yellow, based on the sample results.
Solution:
Given, total number of sweets in the sample = 10 + 8 + 7 + 5 = 30
(i) Given, number of green sweets = 8
$$So, P(\text{getting a green sweet}) = \dfrac{\text{Number of green sweets}}{\text{Total number of sweets}}$$
= 8/30
= 4/15
(ii) Given, number of yellow sweets = 7
$$\begin{aligned} &\text{So, P(getting a yellow sweet)} = \dfrac{\text{Number of yellow sweets}}{\text{Total number of sweets}} = \dfrac{7}{30} \\[12pt] &\text{and given the total number of sweets in the bag = 600} \\[12pt] &\text{So, estimated number of yellow sweets} = \dfrac{7}{30} \times 600 \end{aligned}$$
= 7 X 20
= 140
Question 2.
A survey is conducted at a school where a random sample of 40 students is asked about their favourite club. The responses are:
14 students: Science Club | 11 students: Arts Club | 9 students: Sports Club | 6 students: Debate Club
Assume there are 800 students in the whole school.
(i) What is the probability that a randomly chosen student from the sample prefers the Arts Club?
(ii) Using the sample results, estimate how many students in the whole school are likely to prefer the Sports Club.
Solution:
Number of all possible outcomes in sample = 14 + 11 + 9 + 6 = 40
(i) Number of favourable outcomes = 11 (students preferring the Arts Club)
P(A student prefers Arts Club) = 11/40 = 0.275 or 27.5%
(ii) Number of favourable outcomes = 9 (students preferring the Sports Club)
P(A student prefers Sports Club) = 9/40
Estimate for 800 students = 9/40 X 800 = 180 students likely to prefer the Sports Club.
Question 3.
Toss a coin 20 times and record the result each time (heads or tails).
(i) How many times did you get heads?
(ii) How many times did you get tails?
(iii) Calculate the experimental probability of getting heads.
(iv) If you toss the coin once more, what is the probability of getting tails?
Solution:
(i) It is a practical experiment. Results will vary for each student.
Assume that we get a ‘head’ 13 times.
(ii) We get a tail 7 times (20 – 13).
$$\begin{aligned} &\text{(iii) Experimental Probability} = \dfrac{\text{No. of times heads appeared}}{\text{Total no. of tosses}} = \dfrac{13}{20} \\[20pt] &\text{(iv) On tossing the coin once more, we may get a ‘head’ or a ‘tail’.} \\[12pt] &\text{Case 1. When ‘head’ appears} \\[8pt] &\text{Probability of getting tails} = \dfrac{7}{21} \\[16pt] &\text{Case 2. When ‘tail’ appears} \\[8pt] &\text{Probability of getting tails} = \dfrac{8}{21} \end{aligned}$$
Question 4.
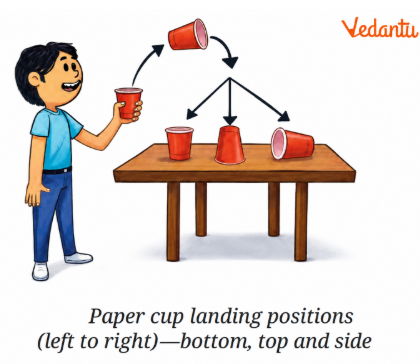
Toss a paper cup into the air 100 times. After each toss, record whether the cup lands on its bottom, upside down on its top, or on its side (See Fig. 7.5). Use experimental probability to assign probabilities to the outcomes.
Solution:
This is a practical experiment so that the results may differ for each student.
Suppose the cup lands on its bottom 38 times and on its top 30 times out of 100 trials.
Therefore, the number of times the cup lands on its side is:
[100 - 38 - 30 = 32]
$$\begin{aligned} &\text{Therefore, P(cup lands on its bottom)} = \dfrac{\text{No. of times cup lands on bottom}}{\text{Total no. of tosses}} = \dfrac{38}{100} \\[20pt] &\text{P(cup lands on its top)} = \dfrac{\text{No. of times cup lands on bottom}}{\text{Total no. of tosses}} = \dfrac{38}{100} \\[20pt] &\text{P(cup lands on its side)} = \dfrac{32}{100} \end{aligned}$$
Question 5.
What is the probability of rolling an even number on a fair 6-sided die?
Solution:
Total possible outcomes when rolling a fair 6-sided die = {1, 2, 3, 4, 5, 6}
∴ Total number of outcomes = 6
Let E be the event of getting an even number.
∵ Even numbers on a die are 2, 4, and 6.
∴ Number of outcomes favourable to E = 3
So, the probability of getting an even number is:
Number of outcomes favourable to E
P(E) = $\dfrac{\text{Number of outcomes favorable to E}}{\text{Total number of outcomes}} = \dfrac{3}{6} = \dfrac{1}{2}$
Question 6.
Suppose you roll a 6-sided die 12 times and get a ‘3’ three times.
(i) What is the experimental probability of rolling a ‘3’?
(ii) What is the theoretical probability of rolling a ‘3’?
(iii) Why might these probabilities be different? What would you expect to happen if you rolled the die 60, 600, or 6000 times?
Solution:
(i) Number of all outcomes = 12 (Total rolls in experiment)
Number of favourable outcomes = 3 (times ‘3’ actually appeared)
$$\begin{aligned} &\text{P(rolling a 3)} = \dfrac{\text{Number of favourable outcomes}}{\text{Number of all outcomes}} \\[8pt] &= \dfrac{1}{6} \end{aligned} $$
= 0.167 or 16.7%
(iii) Difference between Experimental and Theoretical probabilities: The difference exists because experimental probability is based on evidence from a limited sample, while theoretical probability is based on the ideal mathematical outcome. As the number of trials increases, the experimental probability will likely get closer to the theoretical one. This is why a larger sample size makes our estimates more reliable.
Tips to Solve Class 9 Maths Chapter 7 The Mathematics of Maybe: Introduction to Probability Exercise 7.2 Effectively
Understand the concept first: Before starting, revise the key concepts and properties needed for Exercise 7.2. This makes it easier to identify the right approach for each problem.
Work through the steps: Use Class 9 Maths NCERT Solutions Chapter 7 Exercise 7.2 to understand how each problem is solved. Focus on the method, not just the final answer.
Practise on your own: Once you understand a solution, close it and solve the same question independently. This helps improve accuracy and confidence.
Check your mistakes: Compare your working with the NCERT Solutions for Class 9 Maths Chapter 7 Exercise 7.2 and identify where you went wrong.
Revise difficult problems: Mark questions that take more time or seem confusing and practise them again before your test or exam.
Use the PDF for revision: Keep the Maths Class 9 Chapter 7 Exercise 7.2 Solutions PDF handy for quick practice, answer checking, and last-minute revision.
Get Exercise-wise NCERT Solutions for Chapter 7 Maths Class 9
CBSE Class 9 Maths Chapter 7 Related Study Materials
Chapter-Specific NCERT Solutions for Class 9 Maths
Additional Study Materials for Class 9 Maths


FAQs on NCERT Solutions for Class 9 Maths Chapter 7 The Mathematics of Maybe: Introduction to Probability Exercise 7.2 | 2026-27
1. What is the best way to practise Class 9 Maths Chapter 7 Exercise 7.2?
Start by attempting each NCERT problem on your own and identify the concept needed to solve it. Then use the Class 9 Maths Chapter 7 Exercise 7.2 Solutions on Vedantu to check your method and understand any steps you missed.
2. How do NCERT Solutions Class 9 Maths Chapter 7 Exercise 7.2 help with difficult problems?
The solutions from The Mathematics of Maybe: Introduction to Probability explain the correct approach step by step, making it easier to understand why and when to use a particular method. Vedantu’s explanations can also help you clear doubts without relying only on the final answer.
3. How can I improve my accuracy while solving Exercise 7.2?
Read each problem carefully, note the given information, and solve it step by step. After completing your work, compare it with the Class 9 Maths NCERT Solutions Chapter 7 Exercise 7.2 on Vedantu to identify calculation or method-related errors.
4. Should I memorise the solutions for Exercise 7.2 from The Mathematics of Maybe: Introduction to Probability?
No. The goal is to understand the concept and the method of solving. Use the solutions as a guide, then try the problem again independently so you can apply the same approach to similar questions.
5. When should I refer to the Class 9 Maths Chapter 7 Exercise 7.2 Solutions?
Refer to the solutions after attempting the questions yourself. They help you check answers, clear doubts, revise difficult problems, and prepare for tests and exams.
6. Can Vedantu’s Exercise 7.2 solutions be used for quick revision?
Yes. Vedantu’s step-by-step NCERT Solutions for Class 9 Maths Chapter 7, The Mathematics of Maybe: Introduction to Probability, Exercise 7.2 can help you quickly review the methods used and revisit questions that need more practice.