


NCERT Solutions for Class 8 Social Science Chapter 6
Big Questions
1. What is demography?
Answer:
Demography is the study of the size, structure, composition and distribution of a human population. It also studies how a population changes over time because of factors such as births, deaths and migration. Demography helps us understand characteristics such as age, gender, education and occupation within a population.
2. What are some important concepts of demography?
Answer:
Some important concepts of demography are:
Birth rate: The number of live births per 1,000 people in a year.
Fertility rate: The average number of children a woman is expected to have during her lifetime.
Replacement level fertility: The fertility rate needed for one generation to replace itself. It is generally around 2.1 children per woman.
Death or mortality rate: The number of deaths per 1,000 people in a year.
Child mortality rate: The number of deaths of children under five years of age per 1,000 live births.
Life expectancy: The average number of years a newborn is expected to live.
Migration: The movement of people from one place to another.
Sex ratio: The number of females per 1,000 males.
Population pyramid: A graphical representation of a population by age and sex.
Demographic transition: The change from high birth and death rates to lower birth and death rates as a society develops.
Demographic dividend: The potential economic benefit that can arise when a country has a large working-age population.
3. How has the population of India and the world changed over time?
Answer:
The world's population increased rapidly, particularly after the 1950s. Improvements in healthcare, sanitation, nutrition and living conditions reduced death rates and helped people live longer. The global population grew from about 2.5 billion in 1950 to more than 8 billion, although population growth has now slowed in several countries.
India's population has also increased significantly since Independence. At the same time, fertility rates have fallen, life expectancy has increased, and child mortality has declined. India currently has a large working-age population, allowing the country to benefit from a demographic dividend.
4. How do population trends shape societies and economies?
Answer:
Population trends shape a society's needs and development in many ways. A high birth rate can increase the demand for schools, healthcare, housing and future employment. A large working-age population can drive economic growth when people have access to education, skills, and jobs.
On the other hand, very low fertility rates can lead to an ageing population and a smaller workforce. Migration can support urban and economic growth, but it may also increase pressure on housing, transport and other public services. Therefore, understanding population trends helps governments plan for education, employment, healthcare and development.
LET’S EXPLORE
Ask your family members if they have observed any of the following changes around them over the years:
-farmland or green spaces being turned into new buildings for housing
-more crowded streets; more cars and buses; and traffic congestion in public spaces
-changing types of homes (e.g., smaller apartments, more single-family homes). What could be the possible reasons behind these changes?
Answer:
These changes can occur because of population growth, migration and urbanisation. As more people move to towns and cities for employment, education and other opportunities, the demand for housing increases. This can result in farmland and green spaces being converted into residential areas.
A growing urban population also means more vehicles and greater road use, which can lead to crowded streets and traffic congestion. Higher land prices and changing family needs may also lead to smaller homes and apartments.
LET’S EXPLORE
Why is the replacement rate 2.1 and not 2 (parents get replaced by children)? What are the situations in which the replacement rate can be higher?
Answer:
The replacement rate is about 2.1 rather than exactly 2 because not every child survives to adulthood and not everyone goes on to have children. The small additional fraction helps a generation replace itself and keeps the population broadly stable.
The replacement rate may be higher in places where child mortality is high, healthcare facilities are limited, nutrition and living conditions are poor, or mortality among younger people is greater.
LET’S EXPLORE
Observe fertility and literacy rates in select Indian states in Fig. 6.11. Do you find a relationship between the two indicators? Prepare a report on your observations and possible reasons for the same.
Answer:
Yes. The data indicate a relationship between female literacy and fertility rates. States with higher female literacy generally show lower fertility rates, while states with lower female literacy tend to have higher fertility rates.
For example, Bihar has comparatively low female literacy and a higher fertility rate. In contrast, states or Union Territories such as Punjab and Delhi have higher female literacy and lower fertility rates.
One possible reason is that greater access to education can lead to later marriage, better awareness of health and family planning, and increased women's participation in employment. Urbanisation and the higher cost of raising children can also influence families to have fewer children.
THINK ABOUT IT
If many young people migrate from villages or smaller towns to cities, what changes could take place in their native villages?
Answer:
If many young people migrate to cities, villages may have fewer working-age people. This can create labour shortages in farming and other local occupations. The proportion of older people, women and children remaining in the village may also increase.
Migration can also have positive effects. People working in cities may send money back to their families, helping them improve housing, education, healthcare and their overall standard of living. Therefore, migration can bring both social and economic changes to native villages.
LET’S EXPLORE
Census figures from 2001 and 2011 show the overall number of females per 1,000 males is much less than 1,000. Some states, however, had over 1,000 or near 1,000 (Kerala, Puducherry, Tamil Nadu). What might be the reasons for this?
Answer:
States and Union Territories such as Kerala, Puducherry, and Tamil Nadu have had comparatively favourable sex ratios because of several social and developmental factors. Higher female literacy, better access to healthcare, and greater awareness of women's well-being can improve female survival and life expectancy.
Better social development and more equitable treatment of girls and women can also help create a more balanced sex ratio.
THINK ABOUT IT
If the replacement rate is less than 2, what will the population pyramid look like? Will there ever be a situation where the number of children is less than the number of aged people? What is likely to happen to the population of such a country over time?
Answer:
When the replacement rate remains below 2, fewer children are born. As a result, the population pyramid develops a narrower base, while the middle and older age groups may become comparatively wider.
Yes, the number of children can eventually become smaller than the number of older people. If this continues for a long period, the country may experience population ageing and eventually population decline. It may also face a smaller workforce and greater demand for pensions, healthcare and elderly care.
THINK ABOUT IT
Indian society has the concept of āshrama dharma, where life is divided into four phases—brahmacharya, gṛihastāshrama, vānaprasta, and sanyāsa. Though older people begin to withdraw from economic activities, they continue to play other important roles — sharing their knowledge and wisdom with family and society as needed. Cultural continuity becomes possible through their guidance in rituals, storytelling, etc. They hold knowledge that may not necessarily be in books. Can you think of all the ways older people in your neighbourhood contribute to their family and society?
Answer:
Older people contribute to families and society in many valuable ways. They share their experiences and wisdom with younger generations and often guide families when they make important decisions.
They also help preserve traditions by sharing stories, customs, local knowledge and cultural practices. Grandparents may help care for children while parents are working. Older people may also participate in community activities, religious gatherings and social service. In this way, their contribution remains important even when they are no longer actively employed.
Questions and activities
1. Why is it important for a country to study its population through demography?
Answer:
Demography helps a country understand its population size, composition and changes caused by births, deaths and migration. Governments can use this information to plan schools, hospitals, housing, roads, water supply and employment opportunities. It also helps distribute resources and plan future development.
2. How can a low fertility rate affect a country’s future economy and workforce?
Answer:
If fertility remains below the replacement level for a long time, fewer young people will eventually enter the workforce. At the same time, the proportion of older adults may increase.
This can lead to labour shortages and higher spending on healthcare and pensions. With fewer working people supporting a larger elderly population, economic growth may also become more difficult.
3. Do you think a high birth rate is always good for a country? Why or why not?
Answer:
No. A high birth rate is not always beneficial. If births remain high while death rates fall, the population can grow very quickly. This may increase pressure on schools, hospitals, housing, jobs, water, food, transport and other resources.
However, a growing young population can become an advantage when the country provides adequate education, healthcare, skills and employment opportunities.
4. Do you think it’s better to have more people or fewer people in a country? What challenges do countries face with a fast-growing or shrinking population?
Answer:
Neither a very fast-growing population nor a rapidly shrinking population is automatically better.
A fast-growing population can put pressure on housing, land, water, employment, education, healthcare and transport. A shrinking or ageing population can lead to fewer workers and greater pressure on healthcare and pension systems.
What matters is whether a country can provide sufficient resources, services and opportunities for its population.
5. How does the age structure of a country affect the kind of jobs and services it needs? Explain with examples.
Answer:
The age structure determines the types of services and opportunities a country needs.
For example, a country with many children requires more schools, teachers and child healthcare facilities. A large working-age population requires sufficient jobs and skill-development opportunities. A country with many older adults needs more hospitals, elderly-care services and pension support.
6. Why do you think families are generally getting smaller? Does having fewer children ensure better education and health for them? How does it affect families and society?
Answer:
Families are becoming smaller for several reasons, including greater access to education, increased women's participation in the workforce, urbanisation, later marriage, and the rising cost of raising children.
Having fewer children can make it easier for families to devote more time and resources to each child's education, nutrition and healthcare. However, fewer children alone do not automatically guarantee better outcomes; the family's income, access to services and living conditions also matter.
At a wider level, smaller families can slow population growth and gradually change society's age structure.
7. Observe the graph below showing changes in life expectancy across genders in India and answer the questions given below:
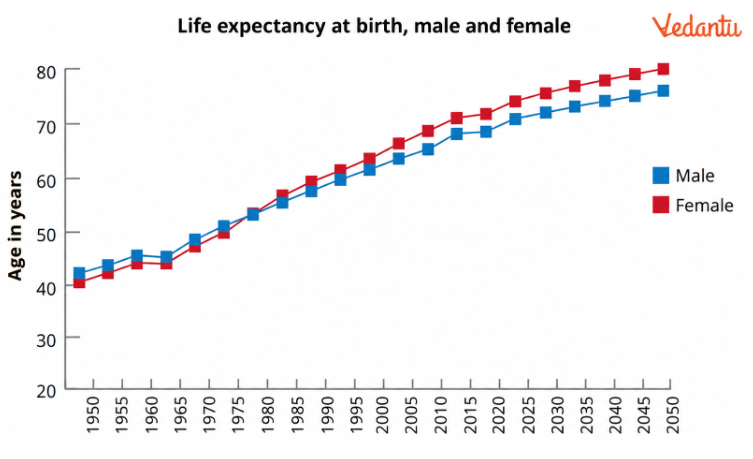
a) Has the life expectancy in India increased? If yes, what could be the reasons?
b) What was the life expectancy of males and females in 2010?
Answer:
a) Yes, life expectancy in India has increased. Improvements in healthcare, sanitation, nutrition, vaccination and medical treatment have reduced mortality and helped people live longer.
b) According to the graph:
Male life expectancy: around 65 years
Female life expectancy: around 68 years
8. What is a demographic dividend, and how does it benefit a country? What do you think India needs to do today to make the most of its demographic dividend before 2050?
Answer:
A demographic dividend is the potential economic benefit a country can gain when a large share of its population is of working age. If this population is healthy, educated, skilled and employed, it can increase productivity, incomes and economic growth.
To make the most of its demographic dividend before 2050, India needs to invest in quality education, skill development, healthcare and employment opportunities. Creating productive jobs for young people is especially important.
9. Choose two countries (for example: India and Japan, or Nigeria and Italy). Find out their:
-Population size
-Fertility rate
-Life expectancy
-Age distribution
How are they different? What might be the reasons behind these differences? For instance, find out how countries with ageing populations are managing this.
Answer:
India and Japan are good examples to compare.
India
India has a very large population and a comparatively young population structure.
Its fertility rate has declined significantly over time.
Life expectancy has increased.
A large proportion of the population is of working age.
Japan
Japan's population is ageing and shrinking.
Its fertility rate is very low.
It has high life expectancy.
Older people form a much larger share of its population than in India.
These differences are linked to fertility, life expectancy, economic development, urbanisation, and social change. Countries with ageing populations may respond by increasing the retirement age, using automation to address labour shortages, and strengthening pension and healthcare systems.
10. Imagine you are a researcher who intends to study migration patterns in your locality. Make a questionnaire to collect data on the following questions.
-Name of the person
-Age of the person
-Occupation of the person
-Place of residence
-Number of years lived in the place
-List the factors contributing to migration, such as lack of facilities, poor infrastructure, limited job opportunities and so on.
Answer:
Migration refers to the movement of people from one place to another, either within a country or across countries. People may migrate for better employment, education, improved facilities, or because of natural disasters and political instability. Migration can be temporary or permanent.
A questionnaire to study migration patterns can include:
(i) What is your original place of residence (village/town/state/country)?
(ii) When did you move to this locality?
(iii) What was the main reason for your migration?
Better employment opportunities
Education
Natural disasters
Political instability
Other reasons
(iv) Is your migration temporary or permanent?
(v) Has migration improved your employment opportunities?
(vi) Has migration brought any changes to your living conditions?
(vii) Do you plan to stay here permanently or return to your original place?
(viii) What challenges do you face in this area, such as housing, water supply or transportation?
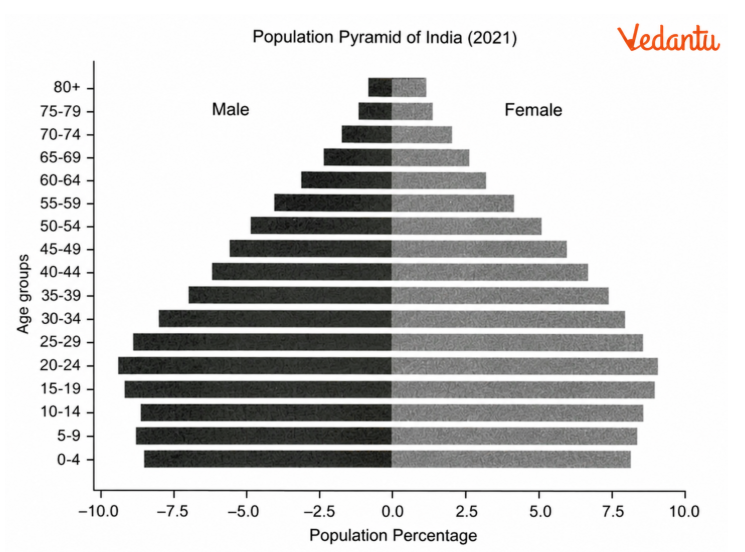
11. Draw a population pyramid on graph paper for India using the data given in the following table. Age-group-wise percentage distribution of population (estimated for 2021)
Answer:
To draw the population pyramid:
Draw a vertical line in the centre of the graph paper.
Mark the age groups on the vertical (Y) axis, beginning with 0–4 at the bottom and ending with 80+ at the top.
Mark equal percentage intervals on both sides of the horizontal (X) axis.
Plot the male population percentages on the left.
Plot the female population percentages on the right.
Draw horizontal bars for every age group using the percentages provided in the question.
Observation:
The younger age groups form a comparatively broad section of the pyramid, while the older age groups become progressively narrower. The data also show a substantial working-age population. This age structure provides India with the potential to benefit from a demographic dividend.
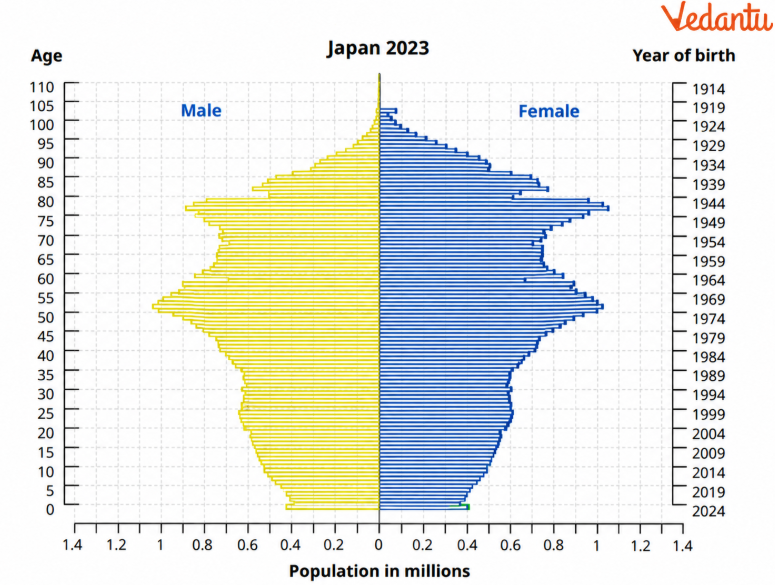
12. Observe the population pyramid for Japan in 2023 below. What can you infer from this? Write your observations and share in the class.
Answer:
The population pyramid of Japan in 2023 shows the following:
The narrow base indicates that relatively fewer children are being born.
The larger middle and older age groups show that Japan has an ageing population.
High life expectancy has contributed to a larger elderly population.
Low fertility has meant fewer young people are entering the population.
Over time, this can shrink the workforce and reduce population growth.
An ageing population can increase the need for healthcare, pensions and elderly-care services.
With fewer working-age people, the country may also face labour shortages and greater pressure on its social-support systems.
Overall, Japan's population pyramid reflects low fertility, high life expectancy and population ageing.
Understand Dynamics of Population with NCERT Solutions
Understand the important concepts and population-related ideas discussed in Dynamics of Population instead of simply memorising answers.
Use the NCERT Solutions for Class 8 Social Science, Chapter 6 (English Medium), alongside Exploring Society: India and Beyond, Part 2, to check textbook answers and revise key concepts.
Connect different factors affecting population change to understand the chapter more clearly.
Practise textbook questions in your own words while keeping important terms and facts accurate.
Download the NCERT Class 8 Social Science Chapter 6 Solutions PDF for convenient revision and exam preparation.
Related Study Materials for CBSE Class 8 Social Science Chapter 6
Explore Chapter-Wise NCERT Solutions for Class 8 Social Science Part 2
Related Study Material for Class 8 Social Science
FAQs on Class 8 Social Science Chapter 6: Dynamics of Population Solutions
1. What is Class 8 Social Science Chapter 6 Dynamics of Population about?
Dynamics of Population introduces students to population-related concepts and explains how and why populations change. Students learn about population patterns and the factors behind these changes.
2. How should I study Dynamics of Population in Class 8?
Start by understanding the important terms and concepts given in the chapter. Then study the examples, diagrams, data or activities provided in the textbook and attempt the chapter questions before referring to the solutions.
3. How can NCERT Solutions for Class 8 Social Science Chapter 6 help students?
The solutions help students check their textbook answers, understand difficult concepts and learn how to present answers clearly. They can also help students revise the chapter before school assessments.
4. What should I focus on while revising Dynamics of Population?
Focus on understanding the key population concepts, the factors responsible for population change and the relationships between different ideas discussed in the chapter. Conceptual understanding is more useful than memorising isolated statements.
5. Are the Class 8 Social Science Chapter 6 solutions useful for exam preparation?
Yes. Students can use the solutions to revise textbook questions, identify important points and practise writing complete answers. The textbook should remain the primary source for studying the chapter.
6. Can I download NCERT Class 8 Social Science Chapter 6 Solutions as a PDF?
Yes. You can download the NCERT Class 8 Social Science Chapter 6 Solutions PDF from Vedantu for convenient revision when students want to revisit the chapter questions and answers.
7. Should I memorise all the answers in Dynamics of Population?
No. It is better to understand the concept behind each question and then practise explaining it in simple language. Remember important terms and factual information accurately, but you don't need to memorise answers word for word.