


Data Handling - Exercise-wise Questions and Answers For Class 7 Maths - Free PDF Download
Class 7 Maths NCERT Solutions for Chapter 3 Data Handling introduces students to data collection, organization, and interpretation. This chapter is fundamental in helping students understand how to manage data effectively and derive meaningful conclusions from it. Data will be presented in tables and frequency distribution tables to identify patterns and trends. Understanding measures like mean, median, and mode to find a representative value of a dataset.
 Table of Content
Students will learn these concepts and solve the problems given in the exercise to build their concepts well. To make this process easier, download and refer to the latest CBSE Class 7 Maths Syllabus prepared by the experts.
Glance on Maths Chapter 3 Data Handling Class 7 Solutions
The data is a collection of information.
The collection, representation, and presentation of data help to organize information.
Data can be collected and organized in the form of a table.
The sum of observations to the total number of observations is known as the Arithmetic Mean.
The mid-value of the observation is known as the Median.
The data that occurs many times in a set is known as Mode.
Graphs and charts help to represent and compare data in pictorial form.
This article contains chapter notes, important questions, exemplar solutions, exercises, and video links for Chapter 3 - Data Handling, which you can download as PDFs.
There are three exercises (20 fully solved questions) in class 7th maths chapter 3 Data Handling.
Access Exercise Wise NCERT Solutions for Chapter 3 Maths Class 7
Exercise 3.1: This exercise focuses on an introduction to Data Handling like understanding the concept of data, collecting and recording data, organizing data into a frequency distribution table, and interpreting data from tables.
Exercise 3.2: This exercise focuses on Mean, Median, and Mode calculation of the mean (average) of a set of numbers, finding the median (middle value) of a set of numbers, and identifying the mode (most frequent value) of a set of numbers.
Exercise 3.3: This exercise focuses on graphical Representation of Data like constructing and interpreting bar graphs, understanding double bar graphs for comparing two sets of data, and creating and reading pie charts to represent data as parts of a whole.
Access NCERT Solutions for Class 7 Maths Chapter 3 – Data Handling
Exercise 3.1
1. Find the range of heights of any ten students in your class.
Ans:
S. No. | Name of Students | Height (in feet) |
1. | Gunjan | 4.2 |
2. | Aditi | 4.5 |
3. | Nikhil | 5 |
4. | Akhil | 5.1 |
5. | Ria | 5.2 |
6. | Akshat | 5.3 |
7. | Abhishek | 5.1 |
8. | Mayank | 4.7 |
9. | Rahul | 4.9 |
10. | Ayush | 4.5 |
We will find the range of heights by getting the difference between the highest height and lowest height.
Range= Highest height – Lowest Height
$ =5.3-4.2\dfrac{z}{3} $
$ =1.1 $
Hence, the range of height of ten students of the class is 1.1 feet.
2. Organize the following marks in a class assessment, in a tabular form: 4, 6, 7, 5, 3, 5, 4, 5, 2, 6, 2, 5, 1, 9, 6, 5, 8, 4, 6, 7.
(i) Which number is highest?
(ii) Which number is lowest?
(iii) What is the range of the lowest?
(iv) Find the arithmetic mean
Ans:
Marks | Tally Marks | Frequency |
1 | | | 1 |
2 | || | 2 |
3 | | | 1 |
4 | ||| | 3 |
5 | |||| | 5 |
6 | |||| | 4 |
7 | || | 2 |
8 | | | 1 |
9 | | | 1 |
1. The highest number among the given data is 9.
2. The lowest number among the given data is 1.
3. We will find the range of marks by getting the difference between the highest value and lowest value.
Range= Highest value – Lowest value
$ =9-1 \\ $
$ =8 \\ $
Hence, the range of marks is 8.
4. We know that, arithmetic mean is the sum of all observations divided by the total number of observations.
$ \text{Mean=}\dfrac{\text{Sum of all observations}}{\text{Number of observations}} \\ $
$ \text{=}\dfrac{4+6+7+5+3+5+4+5+2+6+2+5+1+9+6+5+8+4+6+7}{20} \\ $
$ \text{=}\dfrac{100}{20} \\ $
$ \text{=5} \\ $
3.Find the mean of the first five whole numbers.
Ans: The first five whole numbers are 0, 1, 2, 3, 4.
Arithmetic mean is the sum of all observations divided by total number of observations.
$\text{Mean=}\dfrac{\text{Sum of all observations}}{\text{Number of observations}} \\ $
$ \text{=}\dfrac{0+1+2+3+4}{5} \\ $
$ \text{=}\dfrac{10}{5} \\ $
$ \text{=2} \\ $
Hence, the mean of the first five natural numbers is 2.
4. A cricketer scores the following runs in eight innings: 58, 76, 40, 35, 46, 45, 0, 100. Find the mean score.
Ans: Arithmetic mean is sum of all observations divided by total number of observations.
Number of Observations= 8
$ \text{Mean=}\dfrac{\text{Sum of all observations}}{\text{Number of observations}} \\ $
$ \text{=}\dfrac{58+76+40+35+46+45+0+100}{8} \\ $
$ \text{=}\dfrac{400}{8} \\ $
$ \text{=50} \\ $
Hence, the mean score of the cricketer is 50.
5. Following table shows the points each player scored in four games.
Player | Game 1 | Game 2 | Game 3 | Game 4 |
A | 14 | 16 | 10 | 10 |
B | 0 | 8 | 6 | 4 |
C | 8 | 11 | Did not play | 13 |
Now answer the following questions.
(i) Find the mean to determine A’s average number of points scored per game.
(ii) To find the mean number of points per game for C, would you divide the total points by 3 or 47? Why?
(iii) B played in all the four games. How would you find the meaning?
(iv) Who is the best performer?
Ans:
(i) The average of player A can be determined by dividing the sum of all scores of A by the number of games he played.
$ \text{Mean of player A=}\dfrac{\text{Sum of scored by A}}{\text{Number of games played by A}} \\ $
$ \text{=}\dfrac{14+16+10+10}{4} \\ $
$ \text{ =}\dfrac{50}{4} \\ $
$ \text{ =12}\text{.5} \\ $
Hence, the average number of points scored by A is 12.5.
(ii)For finding average points scored, we divide the total scores by the total number of games played. In this case, C has played 3 games and therefore we will divide the total points by 3 and not by 4.
(iii)B played all 4 games. So, we will divide the total points scored by 4.
$ \text{Mean of player B=}\dfrac{\text{Sum of scored by B}}{\text{Number of games played by B}} \\ $
$ \text{=}\dfrac{0+8+6+4}{4} \\ $
$ \text{=}\dfrac{18}{4} \\ $
$ \text{=4}\text{.5} \\ $
(iv)Best performer is the one who has the highest average score among all the other players.
$ \text{Mean of player A=}\dfrac{\text{Sum of scored by A}}{\text{Number of games played by A}} \\ $
$ \text{=}\dfrac{14+16+10+10}{4} \\$
$ \text{=}\dfrac{50}{4} \\ $
$ \text{=12}\text{.5} \\ $
$ \text{Mean of player B=}\dfrac{\text{Sum of scored by B}}{\text{Number of games played by B}} \\ $
$ \text{=}\dfrac{0+8+6+4}{4} \\ $
$ \text{=}\dfrac{18}{4} \\ $
$ \text{=4}\text{.5} \\ $
$ \text{Mean of player C=}\dfrac{\text{Sum of scored by C}}{\text{Number of games played by C}} \\ $
$ \text{=}\dfrac{8+11+13}{3} \\ $
$ \text{=}\dfrac{32}{3} \\ $
$ \text{=10}\text{.67} \\ $
On comparing means of all players, we can see that the average score of player A is the highest, i.e., 12.5.
Hence, player A is the best performer.
6. The marks (out of 100) obtained by a group of students in a science test are 85, 76, 90, 85, 39, 48, 56, 95, 81 and 75. Find the:
(i) The highest and the lowest marks obtained by the students.
(ii) Range of the marks obtained.
(iii) Mean marks obtained by the group.
Ans:
(i) Highest marks obtained by the student = 95
Lowest marks obtained by the student = 39
(ii) We will find the range of marks by getting the difference between the highest value and lowest value.
Range= Highest value – Lowest value
$ =95-39 \\ $
$ =56 \\ $
Hence, the range of marks obtained is 56.
(iii) For finding average marks scored, we divide the total scores by the total number of observations.
$ \text{Mean of obtained marks=}\dfrac{\text{Sum of marks}}{\text{Total number of marks}} \\ $
$ \text{=}\dfrac{85+76+90+85+39+48+56+95+81+75}{10} \\ $
$ \text{=}\dfrac{730}{10} \\$
$ \text{=73} \\ $
Hence, the mean marks obtained by the group of students is 73.
7. The enrolment in a school during six consecutive years was as follows: 1555, 1670, 1750, 2013, 2540, 2820. Find the mean enrolment of the school for this period.
Ans: To find the mean enrolment, we will divide the sum of numbers of enrolment by the number of years of enrolment period.
$ \text{Mean enrolment=}\dfrac{\text{Sum of number of enrolment}}{\text{Total number of years}} \\$
$ \text{=}\dfrac{1555+1670+1751+2013+2540+2820}{6} \\ $
$ \text{=}\dfrac{12348}{6} \\ $
$ \text{=2058} \\ $
Hence, the mean enrolment of school over 6 years is 2058.
8. The rainfall (in mm) in a city on 7 days of a certain week recorded as follows
Day | Mon | Tue | Wed | Thurs | Fri | Sat | Sun |
Rainfall (in mm) | 0.0 | 12.2 | 2.1 | 0.0 | 20.5 | 5.5 | 1.0 |
(i) Find the range of the rainfall in the above data.
(ii) Find the mean rainfall for the week.
(iii) On how many days was the rainfall less than the mean rainfall.
Ans:
(i) Range of rainfall = Highest rainfall - lowest rainfall
= 20.5 - 0.0
= 20.5 mm
(ii) Mean of a rainfall = $\dfrac{\text{Sum of all Observations}}{\text{Number of observations}}\\ $
= $\dfrac{0.0+12.2+2.1+0.0+20.5+5.5+1.0}{7}$
=$\dfrac{41.3}{7}$
=5.9 mm
(iii) From the mean calculated in (ii) we may observe that for 5 days those are Monday, Wednesday, Thursday, Saturday and Sunday, the rainfall was less than the average rainfall.
9. The height of 10 girls were measured in cm and the results are as follows: 135, 150, 139, 128, 151, 132, 146, 149, 143, 141
(i) What is the height of the tallest girl?
(ii) What is the height of the shortest girl?
(iii) What is the range of data?
(iv) What is the mean height of the girls?
(v) How many girls have heights more than the mean height?
Ans:
(i)As seen from the above given data, the height of the tallest girl is 151cm.
(ii)As seen from the above given data, the height of the shortest girl is 128cm.
(iii)We will find the range of heights by getting the difference between the highest value and lowest value.
$ \text{Range= Highest Value}-\text{Lowest Value} \\ $
$ \text{=151-128} \\ $
$ \text{=23} \\ $
Hence, the range of heights is 23cm.
(iv)To find the mean height, we will divide the sum of heights of all girls by the number of girls.
$ \text{Mean of height=}\dfrac{\text{Sum of heights of all girls}}{\text{Total number of girls}} \\ $
$ \text{=}\dfrac{135+150+139+128+151+132+146+149+143+141}{10} \\$
$ \text{=}\dfrac{1414}{10} \\ $
$ \text{=141}\text{.4} \\ $
Hence, the mean height of girls is 141.4cm.
(v) Mean height is 141.4cm. From the above data, we can see that heights 150, 151, 146, 149 and 143 are more than the mean value.
Hence, five girls have heights more than the mean height.
Exercise 3.2
1. The scores in mathematics test (out of 25) of students is as follows:
\[19,25,23,20,9,20,15,10,5,16,25,20,24,12,20\]
Find the mode and median of this data. Are they same?
Ans. Arranging data in ascending order
\[5,9,10,12,15,16,19,20,20,20,20,23,24,25,25\]
Mode is maximum occurring observation
Since \[20\] occurs \[4\] times,
Mode \[ = 20\]
Number of observation \[ = 15\]
Median \[ = {\left( {\dfrac{{n + 1}}{2}} \right)^{th}}\]observation
\[ = {\left( {\dfrac{{15 + 1}}{2}} \right)^{th}}\]
\[ = {\left( {\dfrac{{16}}{2}} \right)^{th}}\]
\[ = {8^{{\text{th }}}}\]observation
\[ = 20\]
So, both mode and median are \[20\]
Hence, they are same.
2. The runs scored in a cricket match by \[11\] players is as follows:
\[6,15,120,50,100,80,10,15,8,10,15\]
Find the mean, mode and median of this data. Are the three same?
Ans. Runs scored in the match $ = 6,15,120,50,100,80,10,15,8,10,15$
Arranging in ascending order $ = 6,8,10,10,15,15,15,50,80,100,120$,
Here, \[15\] occurs the maximum number of times. Hence, the mode of the data is \[15\]
Now,
Mean $ = \dfrac{{{\text{ Sum of scores }}}}{{{\text{ Number of players }}}}$
$ = \dfrac{{6 + 8 + 10 + 10 + 15 + 15 + 15 + 50 + 80 + 100 + 120}}{{11}}$
$ = \dfrac{{429}}{{11}} = 39$
Therefore, the mean score is \[39\]
Now, the median is the middle observation of the data.
There are \[11\] terms.
Therefore, the middle observation is $\dfrac{{11 + 1}}{2} = {6^{th}}$ term
Therefore, the median of the data is \[15\] .
The mean, median and mode are not the same.
3. The weight (in ${\text{kg}}$) of \[15\] students of a class are:
\[38,42,35,37,45,50,32,43,43,40,36,38,43,38,47\]
(i) Find the mode and median of this data.
Ans. Given, weights of \[15\]students (in${\text{kg}}) = 38,42,35,37,45,50,32,43,43,40,36,38,43,38,47$
Arranging the data in ascending order $ = 32,35,36,37,38,38,38,40,42,43,43,43,45,47,50$
So, \[38\] and \[43\] both occur thrice. So, both \[38\] and \[43\] are the mode of the data.
Now, there are \[15\] values,
So, the median is the $\dfrac{{15 + 1}}{2} = {8^{th}}$ term
Hence, the median value is \[40\].
(ii) Is there more than one mode?
Yes, there are two modes in this data.
4. Find the mode and median of the data:
\[13,16,12,14,19,12,14,13,14\]
Ans. Given, \[13,16,12,14,19,12,14,13,14\]
Arranging in ascending order $ = 12,12,13,13,14,14,14,16,19$
Mode is that observation which occurs the maximum number of times.
Median is the middle observation of the data when the data is arranged in ascending or descending order.
So, \[14\]occurs thrice.
So, the mode is \[14\].
Now, there are 9 values,
So, the median is the $\dfrac{{9 + 1}}{2} = {5^{{\text{th }}}}$ term
Hence, \[14\] is the median value.
5. Tell whether the statement is true or false:
(i) The mode is always one of the numbers in a data.
Ans. True.
Mode is that observation which occurs the maximum number of times.
(ii) The mean is one of the numbers in a data.
Ans. False.
(iii) The median is always one of the numbers in a data.
Ans. False.
For even number of observations, the median is the mean of the \[\dfrac{{n{\text{ }}}}{2}\] and \[{\left( {\dfrac{{n + 1}}{2}} \right)^{th}}\] values.
(iv) The data \[6,4,3,8,9,12,13,9\] has mean \[9.\]
Ans. Mean \[ = \dfrac{{{\text{ Sum of observations }}}}{{{\text{ Number of observations }}}}\]
\[ = \dfrac{{6 + 4 + 3 + 8 + 9 + 12 + 13 + 9}}{8}\]
\[ = \dfrac{{64}}{8}\]
\[ = 8\]
Hence, the statement is False.
Exercise 3.3
1. Use the bar graph to answer the following questions:
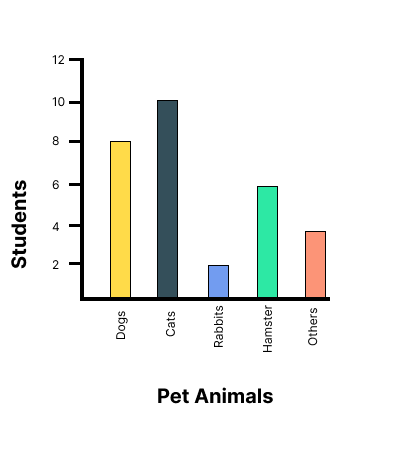
(a) Which is the most popular pet?
Ans: Since the bar representing cats is the tallest, Cat is the most popular pet.
(b) How many students have dog as a pet?
Ans: From the bar graph, 8 students have a dog as a pet.
2. Read the bar graph which shows the number of books sold by a bookstore during five consecutive years and answer the following questions:

(i) About how many books were sold in 1989? 1990? 1992?
Ans: (a) In 1989, 180 books were sold.
(b) In 1990, 475 books were sold.
(c) In 1992, 225 books were sold.
(ii) In which year were about 475 books sold? About 225 books sold?
Ans: From the graph, in 1990, about 475 books were sold and in 1992, about 225 books were sold.
(iii) In which years were fewer than 250 books sold?
Ans: From the graph, it can be concluded that in 1989 and 1992 fewer than 250 books were sold.
(iv) Can you explain how you would estimate the number of books sold in 1989?
Ans: From the graph, it can be concluded that the number of books sold in the year 1989 is about 1 and \[\dfrac{3}{4}{\text{th }}\] part of \[{\text{1cm}}\].
We know that the scale is taken as \[{\text{1cm }} = {\text{ 100 books}}\].
\[100 + \dfrac{3}{4} \times 100 = 100 + 75 = 175\]
Therefore, about 175 books were sold in the year 1989.
3. Number of children in six different classes are given below. Represent the data on a bar graph.
Class | Fifth | Sixth | Seventh | Eighth | Ninth | Tenth |
No.of children | 135 | 120 | 95 | 100 | 90 | 80 |
(a) How would you choose a scale?
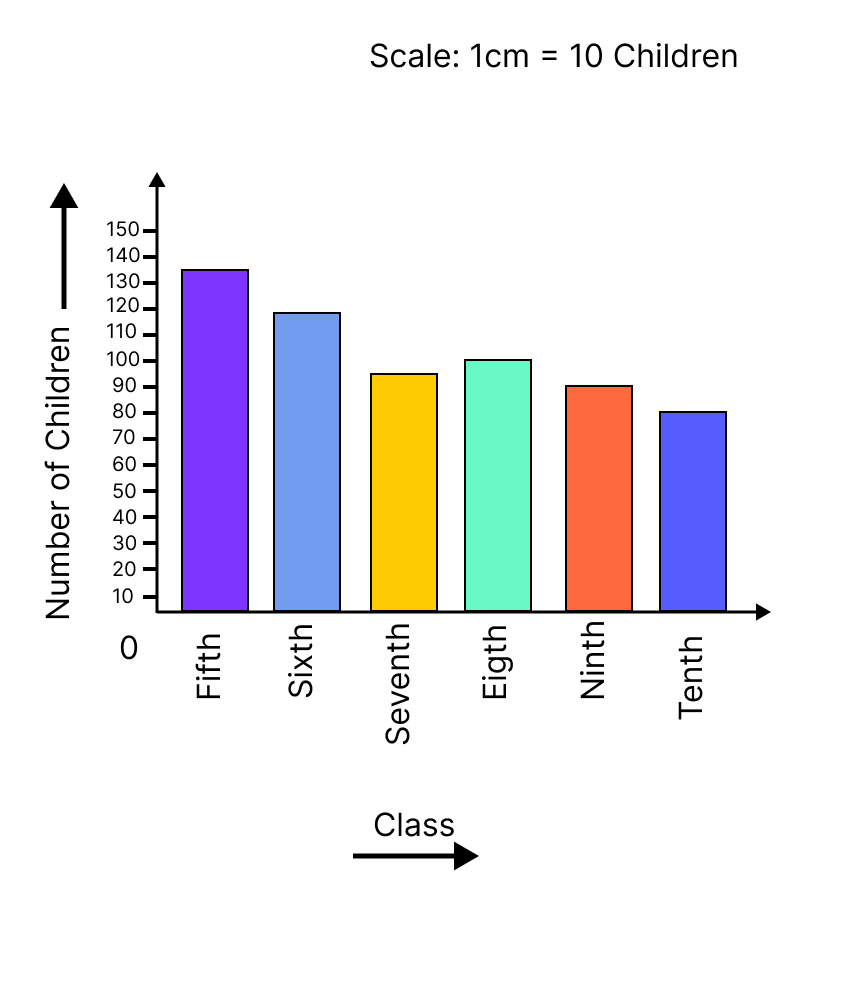
Ans: We will choose a scale as 1 unit = 10 children because we can represent a more clear difference between the number of students of class 7th and that of class 9th by this scale.
(b) Answer the following questions:
(i) Which class has the maximum number of children? And the minimum?
Ans: Since the bar representing the number of children for class fifth is the tallest, there are maximum number of children in class fifth. Similarly, since the bar representing the number of children for class tenth is the smallest, there are minimum number of children in class tenth.
(ii) Find the ratio of students of class sixth to the students of class eighth.
Ans: The number of students in class sixth is 120 and the number of students in class eighth is 100.
Therefore, the ratio \[{\text{ = }}\dfrac{{{\text{the number of students of class sixth}}}}{{{\text{the number of students of class eighth}}}}\]
\[ = \dfrac{{120}}{{100}} = \dfrac{6}{5} = 6:5\]
4. The performance of a student in \[{1^{st}}\] term and \[{2^{nd}}\] term is given. Draw a double bar graph choosing appropriate scale and answer the following:
Subject | English | Hindi | Maths | Science | S.Science |
1st term | 67 | 72 | 88 | 81 | 73 |
2nd term | 70 | 65 | 95 | 85 | 75 |
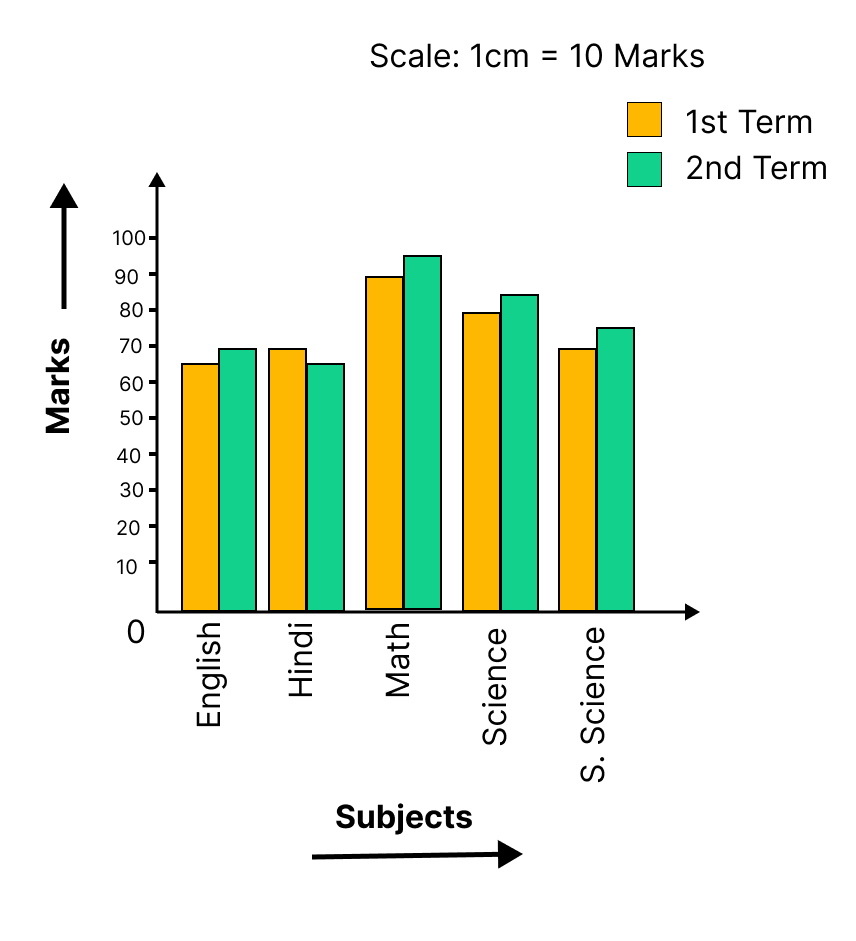
The difference of marks in both terms of each subject.
English \[ = 70 - 67 = 3\]
Hindi \[ = 65 - 72 = - 7\]
Maths \[ = 95 - 88 = 7\]
Science \[ = 85--81 = 4\]
S. Science \[ = 75--73 = 2\]
(i) In which subject has the child improved his performance the most?
Ans: There was a maximum increase in the marks obtained in Maths, which is 7 marks. Therefore, the child has improved his performance the most in Maths.
(ii) In which subject is the improvement the least?
Ans: From the graph, it can be concluded that he only improved 2 marks in S.Science. Therefore, the improvement was the least in S. Science.
(iii) Has the performance gone down in any subject?
Ans: From the graph, it can be observed, in Hindi his marks decreased from 72 to 65. Therefore, in Hindi, his performance has gone down.
5. Consider this data collected from a survey of a colony.
Favourite sport | Cricket | Basket Ball | Swimming | Hockey | Athletics |
Watching | 1240 | 470 | 510 | 423 | 250 |
Participating | 620 | 320 | 320 | 250 | 105 |
(i) Draw a double bar graph choosing an appropriate scale. What do you infer from the bar graph?
Ans: A double bar graph for the given data is as follows.

The double bar graph represents the number of people who like watching and participating in different sports. It can be observed that most of the people like watching and participating in cricket while the least number of people like watching and participating in athletics.
(ii) Which sport is most popular?
Ans: From the bar graph, it can be observed that the bar representing the number of people who like watching and participating in cricket is the tallest among all the bars. Hence, cricket is the most popular sport.
(iii) Which is more preferred, watching or participating in sports?
Ans: The bars representing watching sport are longer than the bars representing participating in sport. Hence, watching different types of sports is more preferred than participating in the sports.
6. Take the data giving the minimum and the maximum temperature of various cities given in the beginning of this Chapter. Plot a double bat graph using the data and answer the following:
Temperatures of the cities on 20.6.2006 | ||||
City | Ahmedabad | Amritsar | Bangalore | Chennai |
Max. Min. | \[{38^ \circ }{\text{C}}\] | \[{37^ \circ }{\text{C}}\] | \[{28^ \circ }{\text{C}}\] | \[{36^ \circ }{\text{C}}\] |
\[{29^ \circ }{\text{C}}\] | \[{26^ \circ }{\text{C}}\] | \[{21^ \circ }{\text{C}}\] | \[{27^ \circ }{\text{C}}\] | |
City | Delhi | Jaipur | Jammu | Mumbai |
Max. | \[{38^ \circ }{\text{C}}\] | \[{39^ \circ }{\text{C}}\] | \[{41^ \circ }{\text{C}}\] | \[{32^ \circ }{\text{C}}\] |
Min. | \[{28^ \circ }{\text{C}}\] | \[{29^ \circ }{\text{C}}\] | \[{26^ \circ }{\text{C}}\] | \[{27^ \circ }{\text{C}}\] |
(i) Which city has the largest difference in the minimum and maximum temperature on the given data?
Ans: A double bar graph for the given data is constructed as follows.

From the graph, it can be concluded that Jammu has the largest difference in its minimum and maximum temperatures on 20.6.2006.
i.e. Maximum temperature \[ = \]\[{41^ \circ }{\text{C}}\] Minimum temperature \[ = \]\[{26^ \circ }{\text{C}}\]
Therefore, Difference \[ = {41^ \circ }{\text{C}} - {26^ \circ }{\text{C = }}{15^ \circ }{\text{C}}\]
(ii) Which is the hottest city and which is the coldest city?
Ans: From the graph, it can be concluded that Jammu is the hottest city due to maximum temperature and Bangalore is the coldest city due to lowest minimum temperature.
(iii) Name two cities where maximum temperature of one was less than the minimum temperature of the order.
Ans: Bangalore and Jaipur, Bangalore and Ahmedabad.
For Bangalore, the maximum temperature was \[{28^ \circ }{\text{C}}\], while minimum temperature of both cities, Ahmedabad and Jaipur, was \[{29^ \circ }{\text{C}}\].
(iv) Name the city which has the least difference between its minimum and the maximum temperature.
Ans: From the graph, it can be concluded that the city which has the least difference between its minimum and maximum temperatures is Mumbai.
i.e. Maximum temperature \[ = {32^o}{\text{C}}\]Minimum temperature \[ = {27^o}{\text{C}}\]
Therefore, Difference \[ = {32^o}{\text{C}} - {27^o}{\text{C}} = {5^o}{\text{C}}\]
Overview of Deleted Syllabus for CBSE Class 7 Maths Data Handling
Class 7 Maths Chapter 3: Exercises Breakdown
Conclusion
Class 7 Chapter 3 Maths, "Data Handling," is fundamental to building a solid understanding of managing and interpreting data. Data Handling is a valuable skill used in various fields. By mastering this chapter, you'll be able to make sense of information around you and draw meaningful conclusions.
This chapter builds a solid understanding of how to manage and interpret data. Students can enhance their analytical skills and apply them in various real-world scenarios by mastering these concepts. This is crucial for understanding more complex topics in statistics and probability.
Other Study Material for CBSE Class 7 Maths Chapter 3
Chapter-Specific NCERT Solutions for Class 7 Maths
Given below are the chapter-wise NCERT Solutions for Class 7 Maths. Go through these chapter-wise solutions to be thoroughly familiar with the concepts.
Important Related Links for NCERT Class 7 Maths
Access these essential links for NCERT Class 7 Maths, offering comprehensive solutions, study guides, and additional resources to help students master language concepts and excel in their exams.

FAQs on NCERT Solutions For Class 7 Maths Chapter 3 Data Handling - 2025-26
1. Where can I find accurate and step-by-step NCERT Solutions for Class 7 Maths Chapter 3 for the 2025-26 session?
Vedantu offers comprehensive NCERT Solutions for Class 7 Maths Chapter 3, Data Handling, which are fully updated for the CBSE 2025-26 syllabus. These solutions are prepared by subject matter experts and provide a detailed, step-by-step methodology for solving every question in the NCERT textbook, ensuring students can learn the correct problem-solving approach.
2. How do the NCERT Solutions for Chapter 3 explain the correct method for calculating the mean?
The NCERT solutions clearly demonstrate the method for calculating the mean or average of a dataset. The process is broken down into simple steps:
- First, find the sum of all the given observations.
- Next, count the total number of observations.
- Finally, divide the sum of observations by the number of observations to find the arithmetic mean.
3. What is the correct procedure for finding the mode and median of a dataset as shown in the Chapter 3 solutions?
As per the NCERT solutions, the first and most critical step is to arrange the given data in ascending or descending order. After arranging the data:
- The mode is the observation that occurs most frequently.
- The median is the value of the middle-most observation. If there is an even number of observations, the median is the average of the two middle values.
4. How many exercises are there in Class 7 Maths Chapter 3, and do the provided solutions cover all questions?
The NCERT textbook for Class 7 Maths Chapter 3, Data Handling, contains four exercises: 3.1, 3.2, 3.3, and 3.4. Vedantu's NCERT Solutions provide complete, expert-verified answers for every single question across all four exercises, ensuring comprehensive coverage of the chapter.
5. How do the NCERT Solutions demonstrate the method for constructing a double bar graph?
The solutions provide a clear, step-by-step guide for creating a double bar graph, which is used to compare two sets of data. The method involves choosing an appropriate scale, drawing and labelling the X and Y axes, and then drawing pairs of bars for each category. Using different colours or patterns for the bars in each pair is essential to distinguish between the two data sets being compared.
6. Why is it important to follow the step-by-step methods shown in the NCERT solutions for Data Handling?
Following the step-by-step methods is crucial as it aligns with the CBSE evaluation pattern. Examiners look for a logical and structured approach, not just the final answer. Using the correct methodology for finding mean, median, mode, or drawing graphs ensures you demonstrate a clear understanding and can score full marks for the question.
7. How do the NCERT Solutions help students decide when to use mean, median, or mode?
By solving the diverse problems in the chapter using the solutions, students learn the appropriate contexts for each measure of central tendency. The mean is best for data sets without extreme values. The median is a better representative when there are outliers that might skew the result. The mode is most useful for identifying the most frequent or popular item in a set. The solutions help clarify these applications through practical examples.
8. What are the key topics for which the NCERT Solutions for Class 7 Maths Chapter 3 provide problem-solving methods?
The NCERT Solutions for this chapter provide detailed methods for solving problems related to key concepts such as:
- Organising raw data into frequency distribution tables.
- Calculating the range of a dataset.
- Finding the measures of central tendency: mean, median, and mode.
- Drawing and interpreting bar graphs and double bar graphs.
- Understanding and calculating basic chance and probability.
9. How do the solutions for Exercise 3.4 help in building a foundational understanding of probability?
The solutions for Exercise 3.4 methodically break down the concept of probability. They teach students how to first identify the total number of possible outcomes in a situation and then determine the number of outcomes that are favourable to a specific event. By showing how to calculate the ratio of (Favourable Outcomes) / (Total Outcomes), the solutions provide a clear and repeatable method for understanding the basics of probability.