


Data Handling Class 8 important questions with answers PDF download
Very Short Answer Type Questions (1 Mark)
1. Collections of Observations are called _______
Ans: Data
2. Difference between highest and lowest values of Observations in a data is called
_______ of the data.
Ans: Range
3. The number of times a particular observation occurs in a given data is called
________
Ans: Frequency
4. Define class size.
Ans: The difference between the upper limit and lower limit of a class interval is called
class size.
5. ________ is a pictorial representation of numerical data in the form of rectangle
(bars) of equal width and varying lengths.
Ans:Bar Graph
6. An operation which produce some well defined outcomes is called an _______
Ans: Random Experiment
7. Each outcome of an experiment is called ________
Ans: Trial
Short Answer Type Questions (2 Marks)
1. Define a random experiment and a trial
Ans: An experiment in which all possible outcomes are already known and the exact outcome cannot be predicted in advance is called a random experiment.
Trial means performing a random experiment.
2. Define probability of occurrence of an event.
Ans: Let \[{\text{E}}\] be an event, then the probability of occurrence of \[{\text{E}}\] is defined as,
${\text{P(E)}} = \dfrac{{{\text{ Number of outcomes favourable to E}}}}{{{\text{ Total number of possible outcomes }}}}$
3. A coin is tossed. What is the probability of getting a tail?
Ans: When a coin is tossed the possible outputs are \[{\text{H, T}}\].
The probability of getting a tail is $\dfrac{1}{2}$.
4. In a deck of \[52\] cards, what is the probability of getting
(a) Black cards
Ans:Total black cards $ = 26$
The probability of getting Black cards is,
${\text{P(E)}} = \dfrac{{26}}{{52}}$
(b) Red cards
Ans: Total Red cards $ = 26$
The probability of getting Red cards is,
${\text{P(E)}} = \dfrac{{26}}{{52}}$
(c) Face cards
Ans: Total Face cards $ = 12$
The probability of getting Face cards is,
${\text{P(E)}} = \dfrac{{12}}{{52}}$
5. When a die is thrown what is the probability of getting prime?
Ans: The possible outcomes when a die is thrown are $1,2,3,4,5,6 = 6$ outcomes the prime numbers are \[2,3,5\].
The possibility of getting prime numbers ${\text{P(E)}} = \dfrac{3}{6} = \dfrac{1}{2}$.
Short Answer Type Questions (3 Mark)
1. Define class intervals, upper limit and lower limit with examples.
Ans: When the number of observations is large, the data is usually organized into graphs called class interval.
The lower value of a class interval is called the lower limit and upper value of class interval is called the upper limit.
Example: \[40{\text{ }} - {\text{ }}45\]class interval
Lower limit $ - \,\,40$
Upper limit $ - \,\,45$
2. Explain the components of a well shuffled deck of \[52\] cards.
Ans: A deck of playing cards has in all \[52\] cards,
(i) It has \[13\] cards, each \[4\] suits namely spades, clubs, hearts and diamonds.
(ii) Cards of spades and cubes are black cards.
(iii) Cards of hearts and diamonds are red cards.
(iv) Kings, Queen and Jacks are known as face cards. Thus, these are in all \[12\] face cards.
3. Out of 45 students in a class 30 are boys and 15 are girls. If chosen randomly what
is the probability that the student is a
(a) boy
Ans: Total number of students $ = 45$
The probability of the student is boy $ = \dfrac{{30}}{{45}} = \dfrac{2}{3}$.
(b) girl
Ans:Total number of students $ = 45$
The probability of the student is girl $ = \dfrac{{15}}{{45}} = \dfrac{1}{3}$.
4. A die is thrown once. What is the probability of
(a) number being less than \[1\]
Ans:Total possible outcomes $ = 1,2,3,4,5,6$
Number being less than $1 = = \dfrac{0}{6} = 0$.
(b) Number being greater than \[{\mathbf{3}}\]
Ans:Total possible outcomes $ = 1,2,3,4,5,6$
Number being greater than $3 = \dfrac{3}{6} = \dfrac{1}{2}$.
Long Answer Type Questions (4 Marks)
1. The below is the data of height of different players recorded. Arrange the data in ascending order and state the frequency of each observation and prepare frequency
table.
$120\;{\text{cm}},100\;{\text{cm}},110\;{\text{cm}},109\;{\text{cm}},100\;{\text{cm}},108\;{\text{cm}},100\;{\text{cm}},110\;{\text{cm}},109\;{\text{cm}},120\;{\text{cm}},108\;{\text{cm}}$,
$107\;{\text{cm}},102\;{\text{cm}},101\;{\text{cm}},150\;{\text{cm}},110\;{\text{cm}},108\;{\text{cm}},120\;{\text{cm}},120\;{\text{cm}},120\;{\text{cm}},120\;{\text{cm}}$.
Ans: Ascending order: $100\;{\text{cm}},100\;{\text{cm}},100\;{\text{cm}},101\;{\text{cm}},102\;{\text{cm}},107\;{\text{cm}},108\;{\text{cm}},108\;{\text{cm}},108\;{\text{cm}}$,$109\;{\text{cm}},110\;{\text{cm}},110\;{\text{cm}},110\;{\text{cm}},120\;{\text{cm}},120\;{\text{cm}},120\;{\text{cm}},120\;{\text{cm}},120\;{\text{cm}},120\;{\text{cm}},150\;{\text{cm}}$
2. When three coins are tossed simultaneously, what are all the possible outcomes?
Ans: When three coins are tossed simultaneously the possible outcomes are,
\[{\text{HHH, HHT, HTH, THH, TTT, TTH, THT, HTT}}\]
What is the probability of getting
(a) all tails
Ans: The probability of getting all tails $ = \dfrac{1}{8}$.
(b) at least one head.
Ans: The probability of getting at least one head $ = \dfrac{7}{8}$.
Long Answer Type Questions (5 Marks)
1. Given below are the $\% $ of attendance obtained by \[20\] students:
\[87,58,80,36,90,92,98,100,84,85,23,52,60,74,89,91,93,87,24,100.\]
Ans: Ascending order $ - 23,24,36,52,58,60,74,80,84,85,87,87,89,90,91,92,93,100,100$
Arrange the data in ascending order and find
(a) Lowest attendance
Ans: Lowest attendance is $23\% $.
(b) Highest attendance
Ans: Highest attendance is $100\% $.
(c) Range
Ans: Range $ = 100 - 23 = 77\% $
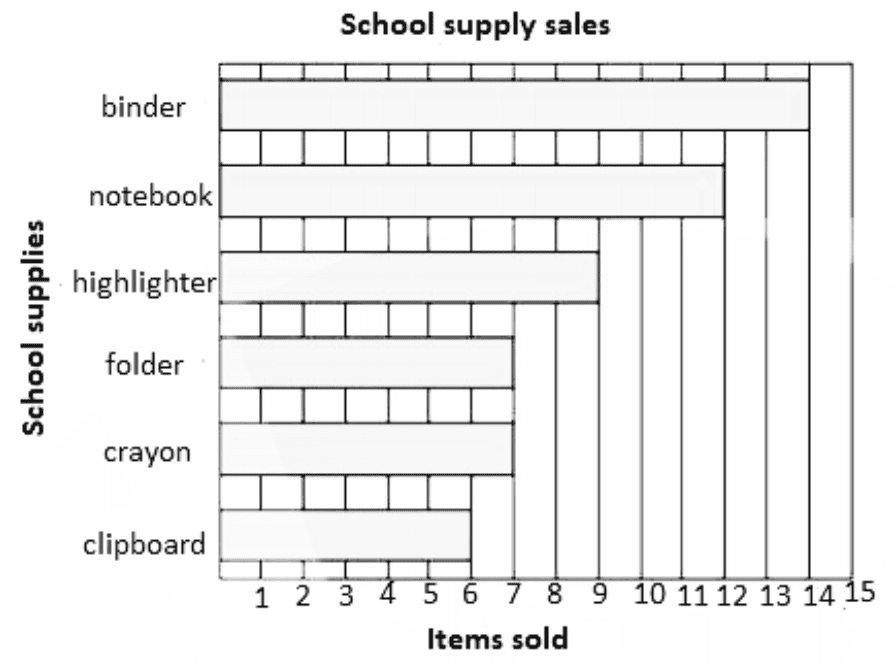
2. Draw a Bar Graph for the data given below:
Scale: $x$ Axis $ = 1\;{\text{cm}}\,{\text{ = }}\,1$ item, $y$ axis $ = 1\;{\text{cm}} = 1$ item
Ans:
3. The bar graph given below shows the sales of books (in thousand number) from six branches of a publishing company during two consecutive years \[2000{\text{ and }}2001.\]
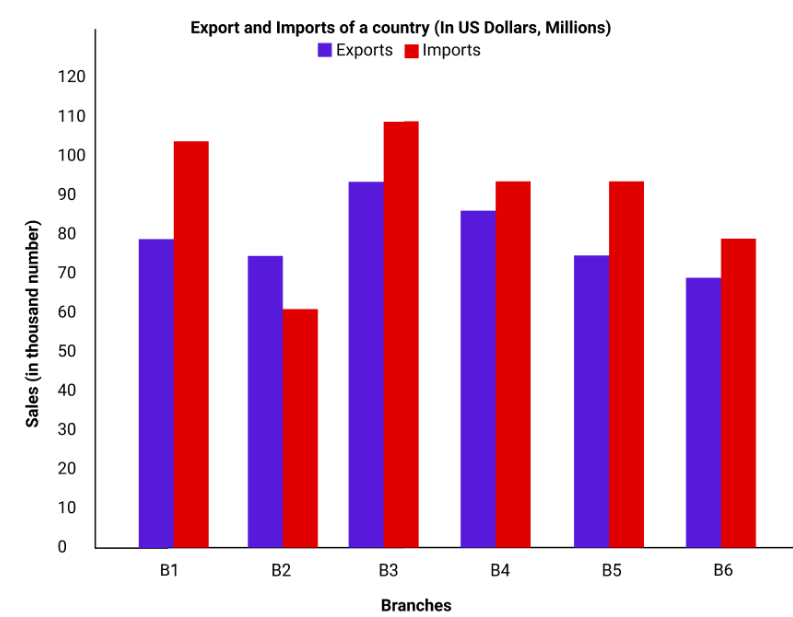
a) What is the ratio of the total sales of branch ${\text{B}}2$ for both years to the total sales of branch \[{\text{B4}}\] for both years?
Ans:Required ratio $ = \dfrac{{(75 + 65)}}{{(85 + 95)}} = \dfrac{{140}}{{180}} = \dfrac{7}{9}$.
b) Total sales of branch ${\text{B}}6$ for both the years is what percent of the total sales of branches ${\text{B}}3$ for both the years?
Ans: Required percentage $ = \left[ {\dfrac{{(70 + 80)}}{{(95 + 110)}} \times 100} \right]\% $
$ = \left[ {\dfrac{{150}}{{205}} \times 100} \right]\% $
$ = 73.17\% .$
c) What percent of the average sales of branches ${\text{B}}1,\;\,{\text{B}}2$ and ${\text{B}}3$ in 2001 is the average
sales of branches \[{\text{B1, B3}}\]and \[{\text{B6}}\]in \[2000?\]
Ans: Average sales (in thousand number) of branches \[{\text{B1, B3 and B6 in 2000}}\]$ = \dfrac{1}{3} \times (80 + 95 + 70) = \left( {\dfrac{{245}}{3}} \right).$
Average sales (in thousand number) of branches \[{\text{B1, B2 and B3 in 2001}}\]
$ = \dfrac{1}{3}{\text{x}}(105 + 65 + 110) = \left( {\dfrac{{280}}{3}} \right)$.
Thus, Required percentage $ = \left[ {\dfrac{{245/3}}{{280/3}} \times 100} \right]\% = \left( {\dfrac{{245}}{{280}} \times 100} \right)\% = 87.5\% $.
d) What is the average sales of all the branches (in thousand numbers) for the year
\[2000?\]
Ans: Average sales of all the six branches (in thousand numbers) for the year \[2000\]
$ = \dfrac{1}{6}{\text{x}}[80 + 75 + 95 + 85 + 75 + 70]$
$ = 80$.
e) Total sales of branches ${\text{B}}1,\;\,{\text{B}}3$ and ${\text{B}}5$ together for both the years (in thousand
numbers) is?
Ans: Total sales of branches ${\text{B}}1,\,\;{\text{B}}3$ and ${\text{B}}5$ for both the years (in thousand numbers)
$ = (80 + 105) + (95 + 110) + (75 + 95)$
$ = 560$
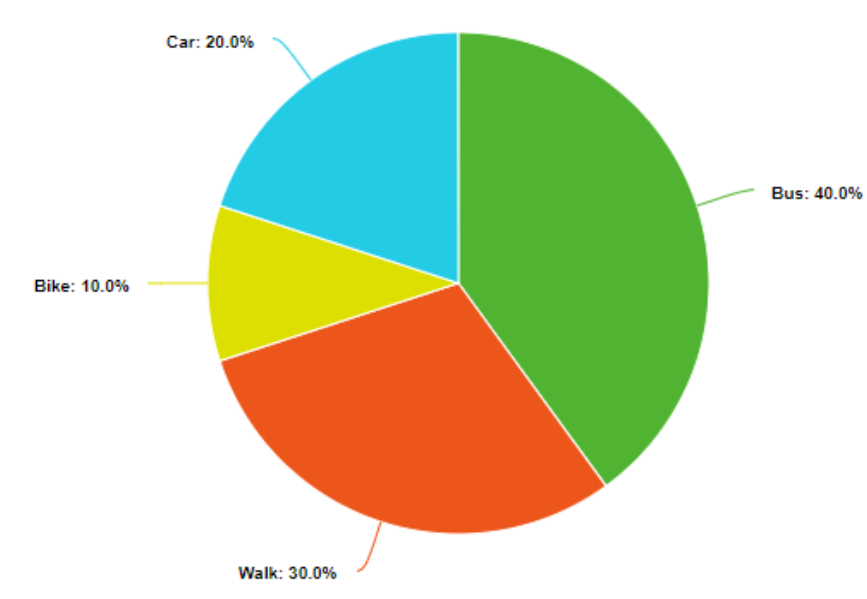
4. Construct a pie chart for the data given below:
Ans:
The pie chart is,
5. Answer the questions using the data from the pie chart given below:
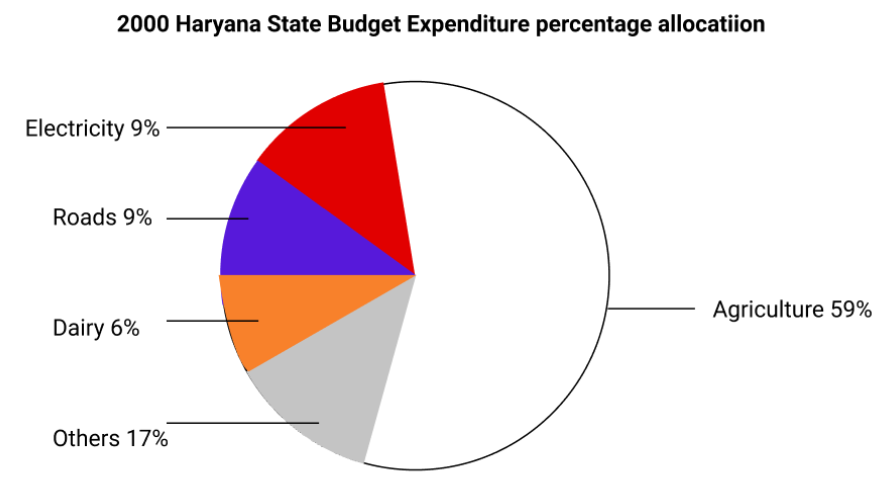
a) Approximately how many degrees should be there in the central angle of the sector for agriculture expenditure?
Ans:In a pie chart, $100\% $ is spread over ${360^\circ }.$
Therefore $1\% = {3.6^\circ }.$
Agriculture expenditure $ = 59\% $.
Then, $3.6 \times 59 = {212.4^\circ }$.
Therefore, ${212.4^\circ }$ should be there in the central angle of the sector for agriculture expenditure.
b) Approximately what is the ratio of expenditure on agriculture to that on dairy?
Ans:Over here, one common mistake is that students calculate the actual values of agriculture and dairy. Since budget expenditure is proportional to $\% $ of area covered, ratio of agriculture to dairy expenditure would be the ratio of corresponding $\% $ allocations.
Therefore, $\dfrac{{{\text{Agriculture}}}}{{{\text{Diary}}}} = \dfrac{{59}}{6}$.
c) In Haryana, in \[2000\] , a total expenditure of Rs. $120\,{\text{mn}}$ was incurred. Approximately How many million did the Haryana government spend on roads?
Ans:Total expenditure $ = 100\% = $ Rs. $120\,{\text{mn}}.$
Expenditure on roads $ = 9\% = \dfrac{9}{{100}} \times 120 = {\text{Rs}}$. $10.8\,{\text{mn}}$.
Therefore, the Haryana government spend on roads about Rs. $10.8\,{\text{mn}}$.
d) If Rs. $9\,{\text{mn}}$ were spent in \[2000\] on Dairy, what would have been the total expenses in that year in million?
Ans: $9\,{\text{mn}}$ were spent on dairy.
This amount represents $6\% $ of total expenditure in the year \[2000.\]
$6 = $\[\left( {\dfrac{{{\text{Dairy expenditure}}}}{{{\text{Total expenditure}}}}} \right)\]$ \times 100$
$6 = \left( {\dfrac{{\text{9}}}{{{\text{Total}}\,{\text{expenditure}}}}} \right) \times 100$
Total expenditure $ = 100 \times \dfrac{9}{6} = $ Rs. $150\,{\text{mn}}$
Therefore, the total expenses in that year in million is Rs. $150\,{\text{mn}}$.
5 Important Formulas from Class 8 Maths Chapter 4 Data Handling
Tips to Learn Class 8 Maths Chapter 4 Data Handling
Start with learning key terms like mean, median, mode, range, and probability. These are the building blocks for solving problems in data handling.
Spend time drawing bar graphs, pie charts, and histograms. Practice labelling them neatly to understand how data is visually represented.
Try solving examples like calculating averages for cricket scores or chances of winning a game. It makes learning more practical and fun.
Understand the concept of likelihood by working on easy examples, like rolling dice or flipping coins. This will prepare you for advanced topics later.
Go over the important formulas and concepts frequently to keep them fresh in your memory, especially before exams.
Practice important questions and sample problems from your textbook and reference books to gain confidence in solving different types of problems.
Benefits of CBSE Class 8 Maths Chapter 4 Data Handling Important Questions
These important questions can be accessed online or downloaded easily and for FREE. It will help you make your practice sessions more productive.
The solutions will help you resolve doubts on your own.
Focus on how the experts have solved these problems in the solutions and follow the same to score more in the exams.
These questions will act as a guide for the students throughout the learning process. It will help them to get a hold of the chapter and understand its concepts properly.
Conclusion
Important Questions for CBSE Class 8 Maths Chapter 4 Data Handling serves as a valuable resource in a student's mathematical journey. This chapter lays the foundation for essential data analysis skills, equipping students with the ability to collect, organise, and interpret data effectively. The questions presented challenge students to apply their knowledge to real-world scenarios, fostering critical thinking and problem-solving abilities. Moreover, these questions prepare students for examinations by covering a wide range of topics within data handling. They empower learners to become data-literate individuals capable of making informed decisions and finding practical applications for data analysis in various fields.
Related Study Materials for CBSE Class 8 Maths Chapter 4
CBSE Class 8 Maths Chapter-wise Important Questions
Other Important Related Links for CBSE Class 8 Maths

FAQs on Important Questions For Class 8 Maths Chapter 4 Data Handling - 2025-26
1. What are the benefits of solving important questions for CBSE Class 8 Maths, Chapter 4 (Data Handling)?
Solving a curated list of important questions for Data Handling helps students to:
- Focus on exam-oriented topics that are frequently asked in CBSE exams.
- Understand the marking scheme and the types of questions to expect, from 1-mark MCQs to 5-mark problems.
- Practise HOTS (Higher Order Thinking Skills) questions that test deep conceptual understanding.
- Improve speed and accuracy for the 2025-26 final examination pattern.
2. Which topics in Class 8 Maths Chapter 4, Data Handling, are most important for the 2025-26 exams?
For the 2025-26 session, the most important topics from which questions are frequently asked are:
- Constructing and interpreting Histograms for grouped data.
- Creating and analysing Pie Charts, which includes the calculation of central angles.
- Solving problems based on Chance and Probability, focusing on outcomes and events.
- Organising raw data into a grouped frequency distribution table.
3. What is the main difference between a bar graph and a histogram, a common point of confusion in exams?
The key difference, which is often tested, is that a bar graph is used to compare discrete categories, and therefore has gaps between the bars. In contrast, a histogram is used to represent data in continuous class intervals, and crucially, has no gaps between the bars to show the continuous nature of the data.
4. What types of important questions can be expected from the 'Pie Chart' section in an exam?
Questions on Pie Charts typically come in two forms. First, you might be asked to interpret a given pie chart to find the value or fraction of a specific category. Second, and more common for higher marks, you will be given raw data and asked to construct a complete pie chart. This requires showing calculations for the central angle (Fraction × 360°) for each category before drawing it accurately.
5. How are important questions on 'Probability' designed to test concepts in the Class 8 exam?
Exam questions on Probability test more than just formula recall. You can expect problems that require you to:
- List all possible outcomes of a random experiment, such as tossing two coins or drawing a card from a deck.
- Calculate the probability of a specific event happening.
- Solve application-based questions where the probability must be determined from data given in a frequency table or another format.
6. What makes a question a 'HOTS' (Higher Order Thinking Skills) question in the Data Handling chapter?
A HOTS question in Data Handling requires applying multiple concepts or critical thinking, not just a single formula. For instance, instead of just asking for the probability of drawing a blue marble from a bag, a HOTS question might ask you to calculate how many red marbles must be added to the bag to change the probability of drawing a blue marble to a new, specified value like 1/3.
7. To get full marks on a 5-mark question to construct a histogram, what are the essential steps to show?
To secure full marks for constructing a histogram, you must clearly present these steps:
- Check if the class intervals are continuous. If they are discontinuous (e.g., 20-29, 30-39), you must first convert them into continuous intervals (e.g., 19.5-29.5, 29.5-39.5).
- Choose and mention an appropriate scale for both the x-axis (class intervals) and y-axis (frequency).
- Properly label both axes with their respective quantities (e.g., 'Marks' on x-axis, 'Number of Students' on y-axis).
- Draw the rectangular bars corresponding to the frequencies, ensuring there are no gaps between them.
8. Why is it so crucial to choose the correct class interval when organising data for a histogram?
Choosing the correct class interval is critical because it directly affects the story the data tells. A class interval that is too wide might over-simplify the data, hiding important peaks or variations. An interval that is too narrow can create a chaotic and confusing graph. The goal, which is a tested skill, is to select an interval that provides a clear and meaningful summary of the data's distribution.