


What Is Position Time Graph?
Motion is the change within the position of a particle or an object with time. Here we tend to confine the study of the motion of objects on a straight line, referred to as linear motion. There are three main kinematics graphs: displacement-time graphs, velocity-time graphs, and acceleration-time graphs. Graphical illustration makes it simpler for us to understand the information. When analysing motion, graphs representing values of various parameters of motion make it easier to solve problems.
Position Time Graph
A graph drawn by taking time on the x-axis and displacement on the y-axis is termed a position-time graph. The principle is that the slope of the line on a position-time graph reveals useful data concerning the velocity of the object. The motion of an object is often represented by a position-time graph. Using this we can analyse completely different aspects of the motion of an object.
Position Time Graph of a Body at Rest
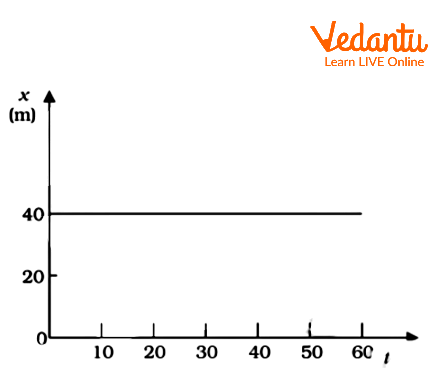
The position-time graph for a stationary object is a straight line parallel to the time axis as shown below. The displacement of a body at rest remains the same till it starts moving
Position Time Graph
Position-Time Graph for Uniform Motion
If an object is moving along a straight line and covers equal distances in equal intervalsof time, then it is said to be in uniform motion. Refer to the figure given below for such a motion.
Position-time Graph for Uniform Motion
How to Find Velocity from Position Time Graph?
When the object is in motion, its position changes with time. How fast the position is changing with time, is what we called as average velocity. That is average velocity can be defined as the change in position or displacement of an object with time known as average velocity (v).
\[v=\frac{{{x}_{2}}-{{x}_{1}}}{{{t}_{2}}-{{t}_{1}}}=\frac{\delta x}{\delta t}\]
Here, x1 and x2 are the positions of the object at times t1 and t2.
The SI unit of velocity is m/s. Velocity is also a vector quantity that possesses both magnitude and direction.
The average velocity can be positive or negative depending on the sign of the displacement we consider. If the displacement is zero then the velocity is also zero. The figure given below shows the x-t graphs under different conditions.
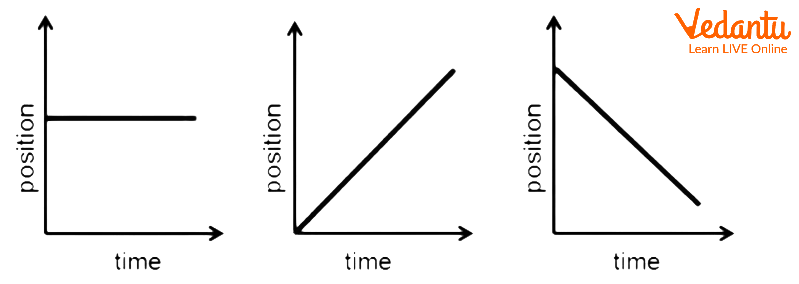
Different Position Time Graphs
The velocity can be found from the slope of position time graphs. For the first figure, the slope is zero means the velocity is zero. For the second one, the slope is positive and hence the velocity is positive. For the third graph, the slope of the graph is negative so is the velocity. One more point to note here is the steeper the slope the higher the value of velocity.

Position vs Time Graph and Relation with Velocity
Average velocity which was defined earlier only involves the displacement of the object. The magnitude of the displacement can be different from the actual path length, so we introduce another parameter known as average speed.
Average speed is defined as the total path length travelled divided by the time interval during which the motion took place.
$Average\text{ }spe\text{ed=}\frac{Total\text{ }distance}{Total\text{ }time}$
This quantity is always positive, unlike the average velocity. If the motion of the object is along the straight line and in the same direction then the velocity is positive. We can say that the magnitude of the average velocity is equal to the average speed.
Position Time Graph Under Uniform Acceleration
Acceleration
When the velocity of an object changes its course of motion with time, it is known as acceleration. Thus, we can say acceleration is the rate of change of velocity with time.
The average acceleration can be defined over a time interval as follows:
$a=\frac{{{v}_{2}}-{{v}_{1}}}{{{t}_{2}}-{{t}_{1}}}$
Here v2 and v1 are the final and initial velocities. The unit of acceleration is m/s2. The acceleration at an instant is the slope of the tangent to the v-t graph. As we define velocity based on the slope we obtain, acceleration also depends on this, which means acceleration also can be positive, negative, or zero. Here we are constraining ourselves to the motion under uniform acceleration for the position-time graph.
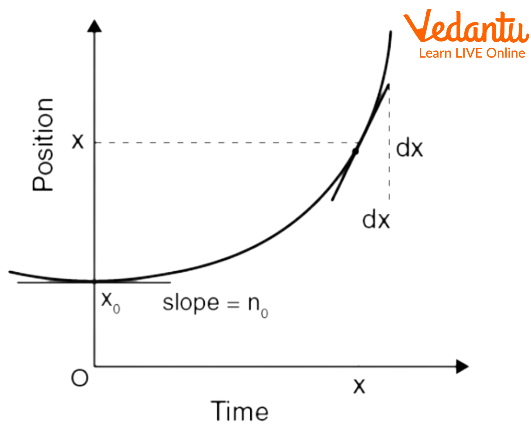
For uniformly accelerated motion along the straight line, the position time graph is as follows.
Position Time Graph Under Uniform Acceleration
The relation between the x0 the initial position, x, the final position, time t, and acceleration a with the initial velocity u0 is given below
$x={{x}_{0}}+{{u}_{0}}+\frac{1}{2}a{{t}^{2}}$
An object is said to be in uniformly accelerated motion when its velocity increases by an equal amount in equal intervals of time when travelling in a straight line.
Summary
A position-time graph is a graph that shows the changes within the values of a variable over time. Time is usually represented on the vertical axis, and therefore the values are on the horizontal axis of a position-time graph. When an object is moving in a uniform motion, the objects travel an equal distance in equal intervals of time. So, for the object moving in uniform motion, its position-time graph will be a straight line with relation to the time axis. We can use a position-time graph to help us understand the motion of an object.
FAQs on Position-Time Graph: Object in Motion
1. What is a position-time graph and what fundamental information does it provide?
A position-time graph is a visual representation that plots an object's position (on the y-axis) against time (on the x-axis). Its primary purpose is to illustrate the motion of an object over a specific period. From this graph, you can determine the object's location at any given moment, its velocity, and whether its motion is uniform, accelerated, or if it is at rest.
2. How is a stationary object represented on a position-time graph?
An object at rest, or a stationary object, is represented by a horizontal straight line on a position-time graph. This line is parallel to the time axis (x-axis) because the object's position (its y-value) remains constant as time progresses.
3. What does the position-time graph for an object in uniform motion look like?
For an object moving with uniform velocity, the position-time graph is a straight line with a constant, non-zero slope. The straight line indicates that the object covers equal distances in equal intervals of time. The steepness of the slope corresponds to the magnitude of the velocity.
4. How does a position-time graph depict uniformly accelerated motion?
Uniformly accelerated motion is shown as a curved line (a parabola) on a position-time graph. The curve's steepness changes continuously, which signifies that the object's velocity is changing at a constant rate. An upward-opening curve indicates positive acceleration, while a downward-opening curve represents negative acceleration (deceleration).
5. What does the slope of a position-time graph signify, and why is it important?
The slope of a position-time graph represents the velocity of the object. This is a crucial concept as it directly translates the graphical shape into a physical quantity. The importance of the slope is that it tells us not just the speed, but also the direction of motion:
- A positive slope means the object has positive velocity (moving away from the origin).
- A negative slope means the object has negative velocity (moving towards the origin).
- A zero slope (a horizontal line) means the object has zero velocity (is at rest).
- A steeper slope, whether positive or negative, signifies a higher speed.
6. What is the key difference between a position-time graph and a distance-time graph?
The main difference lies in the quantities they plot. A position-time graph plots displacement, which is a vector and can be positive or negative, indicating direction. Its slope can therefore be negative, representing velocity. Conversely, a distance-time graph plots the total path length, which is a scalar and can never decrease. Its slope, which represents speed, is always non-negative.
7. Can a position-time graph have a negative slope? If so, what real-world motion does this represent?
Yes, a position-time graph can have a negative slope. This represents an object moving with a negative velocity. In a real-world context, this means the object is moving back towards its starting point or origin (the reference point defined as zero position). For example, if a car drives away from home and then returns, the journey back home would be depicted by a line with a negative slope.
8. Why can't a position-time graph have a vertical line segment?
A vertical line segment is impossible on a position-time graph because it would mean an object is at multiple different positions at the exact same instant in time. This defies the laws of physics. Mathematically, a vertical line has an undefined or infinite slope, which would imply an infinite velocity, another physical impossibility.