


Class 7 Maths Chapter 5 (Ganita Prakash II) Connecting the Dots Solutions PDF Download
5.1 Of Questions and Statements, 5.2 Representative Values
Figure it Out
1. Shreyas is playing with a bat and a ball — but not cricket. He counts the number of times he can bounce the ball on the bat before it falls to the ground. The data for 8 attempts is 6, 2, 9, 5, 4, 6, 3, 5. Calculate the average number of bounces of the ball that Shreyas is able to make with his bat.

Answer:
Number of bounces in 8 attempts = 6, 2, 9, 5, 4, 6, 3, 5
Average number of bounces
= Sum of all the bounces ÷ Number of attempts
= (6 + 2 + 9 + 5 + 4 + 6 + 3 + 5) ÷ 8
= 40 ÷ 8
= 5
Therefore, Shreyas can make an average of 5 bounces with his bat.
2. Try the activity above on your own. Collect data for 7 or more attempts and find the average.
Answer:
Let us take the number of bounces in 7 attempts as:
5, 7, 4, 6, 8, 3, 9
Average number of bounces
= Sum of all the bounces ÷ Number of attempts
= (5 + 7 + 4 + 6 + 8 + 3 + 9) ÷ 7
= 42 ÷ 7
= 6
Therefore, the average number of bounces is 6.
Note: This is a sample answer. The actual answer will depend on the data collected during the activity.
3. Identify a flowering plant in your neighbourhood. Track the number of flowers that bloom every day over a week during its flowering season. What is the average number of flowers that bloomed per day?
Solution:
Do yourself.
4. Two friends are training to run a 100 m race. Their running times over the past week are given in seconds — Nikhil: 17, 18, 17, 16, 19, 17, 18; Sunil: 20, 18, 18, 17, 16, 16, 17. Who on average ran quicker?
Answer:
For Nikhil:
Average time
= (17 + 18 + 17 + 16 + 19 + 17 + 18) ÷ 7
= 122 ÷ 7
= 17.43 seconds
For Sunil:
Average time
= (20 + 18 + 18 + 17 + 16 + 16 + 17) ÷ 7
= 122 ÷ 7
= 17.43 seconds
Therefore, both Nikhil and Sunil ran equally quickly on average, with an average time of approximately 17.43 seconds.
5. The enrolment in a school during six consecutive years was as follows: 1555, 1670, 1750, 2013, 2040, 2126. Find the mean enrolment in the school during this period.
Answer:
Enrolment during six consecutive years = 1555, 1670, 1750, 2013, 2040, 2126
Mean enrolment
= Sum of enrolments ÷ Number of years
= (1555 + 1670 + 1750 + 2013 + 2040 + 2126) ÷ 6
= 11,154 ÷ 6
= 1,859
Therefore, the mean enrolment in the school during this period is 1,859 students.
Figure it Out
1. Find the median of onion prices in Yahapur and Wahapur.
Solution
1. Median of Yahapur onion prices
Monthly onion prices in Yahapur in ascending order:
24, 25, 26, 28, 30, 35, 39, 43, 44, 49, 56, 59
There are 12 values, so:
Median = Average of 6th and 7th values
= (35 + 39) / 2
= 37
Median price in Yahapur = ₹37
2. Median of Wahapur onion prices
Monthly onion prices in Wahapur in ascending order:
17, 19, 23, 30, 35, 38, 39, 42, 42, 52, 53, 60
There are 12 values, so:
Median = Average of 6th and 7th values
= (38 + 39) / 2
= 38.5
Final Answer
Yahapur = ₹37
Wahapur = ₹38.50
2. Sanskruti asked her class how many domestic animals and pets each had at home. Some of the students were absent. The data values are 0, 1, 0, 4, 8, 0, 0, 2, 1, 1, 5, 3, 4, 0, 0, —, 10, 25, 2, — , 2, 4. Find the mean and median. How would you describe this data?
Solution
Given data:
0, 1, 0, 4, 8, 0, 0, 2, 1, 1, 5, 3, 4, 0, 0, 10, 25, 2, 2, 4
Mean:
Sum = 72
Number of observations = 20
Mean = 72 ÷ 20 = 3.6
Median:
Arranged data:
0, 0, 0, 0, 0, 0, 1, 1, 1, 2, 2, 2, 3, 4, 4, 4, 5, 8, 10, 25
Median = (10th + 11th) ÷ 2
= (2 + 2) ÷ 2
= 2
Final Answer:
Mean = 3.6
Median = 2
Description: The data has an unusually high value, 25, so the mean is higher than the median.
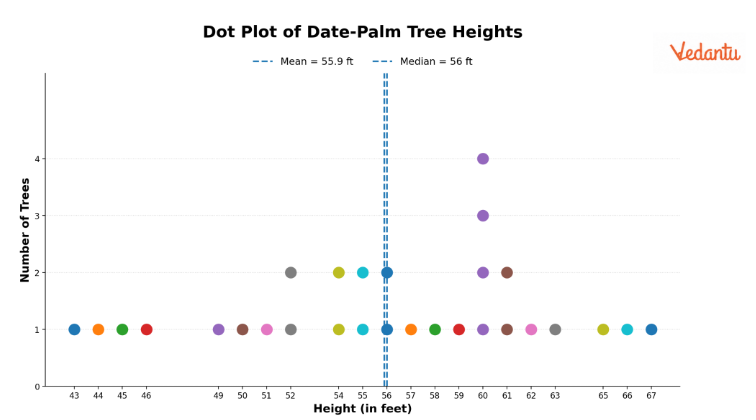
3. Rintu takes care of a date-palm tree farm in Habra. The heights of the trees (in feet) in his farm are given as: 50, 45, 43, 52, 61, 63, 46, 55, 60, 55, 59, 56, 56, 49, 54, 65, 66, 51, 44, 58, 60, 54, 52, 57, 61, 62, 60, 60, 67. Fill the dot plot, and mark the mean and median. How would you describe the heights of these palm trees? Can you think of quicker ways to find the mean? How many trees are shorter than the average height?
Solution
Heights of the date-palm trees in ascending order:
43, 44, 45, 46, 49, 50, 51, 52, 52, 54, 54, 55, 55, 56, 56, 57, 58, 59, 60, 60, 60, 60, 61, 61, 62, 63, 65, 66, 67
Total number of trees = 29
Since 29 is an odd number, the median is the 15th term.
Median = 56 feet
Sum of heights = 1621
Mean = Sum of heights ÷ Number of trees
= 1621 ÷ 29
= 55.89 feet
There are 13 trees shorter than the average height of 55.89 feet.
The heights of the trees range from 43 to 67 feet, with most trees having heights between 55 and 60 feet.
Final Answer:
Mean = 55.89 feet
Median = 56 feet
Number of trees shorter than the average height = 13
4. The daily water usage from a tap was measured. The usage in liters for the first few days are: 5.6, 8, 3.09, 12.9, 6.5, 12.1, 11.3, 20.5, 7.4.
(a) Can the mean or median daily usage lie between 25 and 30? Justify your claim using the meaning of mean and median.
(b) Can the mean or median be lesser than the minimum value or greater than the maximum value in a data?
Solution
(a) The mean or median cannot be between 25 and 30 litres.
The smallest value is 3.09 litres and the largest value is 20.5 litres. The mean and median always lie between the smallest and largest values.
So, neither the mean nor the median can be between 25 and 30 litres.
(b) No. The mean and median cannot be smaller than the minimum value or larger than the maximum value. They always lie within the range of the data.
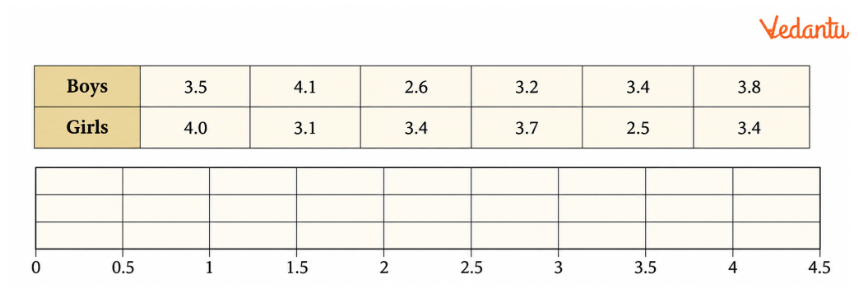
5. The weights of a few newborn babies are given in kgs. Fill the dot plot provided below. Analyse and compare this data.
Solution:
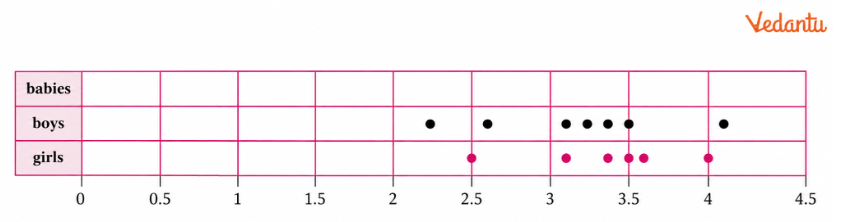
The weight of boys is between 2.6 kg and 4.1 kg.
The weight of girls lies between 2.5 kg and 4 kg.
The heaviest baby is a boy, and the lightest is a girl.
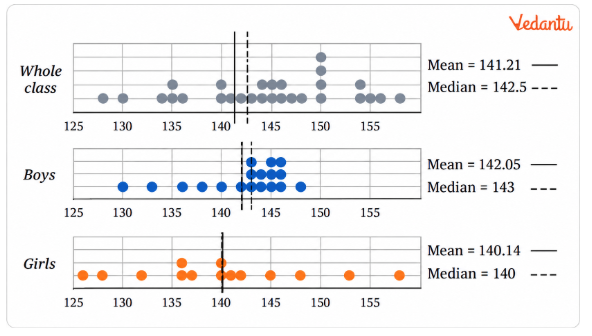
6. The dot plots of heights of another section of Grade 5 students of the same school are shown below. Can you share your observations? What can we infer from the dot plots and the central tendency measures?
Solution:
We can understand the data from the dot plots and the measures of central tendency.
The girls’ heights are more spread out and range from 126 to 158.
The boys’ heights range from 130 to 148.
Both the tallest and shortest students in the class are girls.
However, the girls’ average height is lower than the average height of the whole class and also lower than the boys’ average height.
Therefore, we can say that boys are taller than girls in this class.
For boys’ heights, mean < median (142.05 < 143), showing a small influence of values on the lower side.
For girls’ heights, mean > median (140.14 > 140), showing a small influence of values on the higher side.
When we compare these heights with the data from the previous example of the Grade 5 section, we find that the boys and girls in this section are shorter in height.
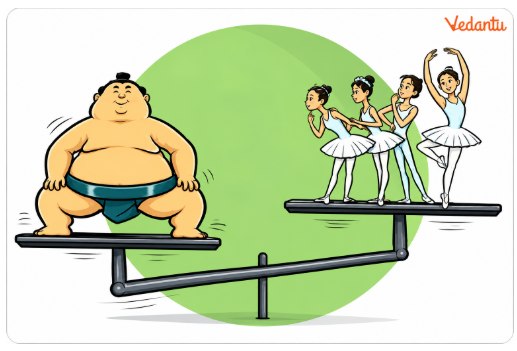
7. The weights of some sumo wrestlers and ballet dancers are:
Sumo wrestlers: 295.2 kg, 250.7 kg, 234.1 kg, 221.0 kg, 200.9 kg.
Ballet dancers: 40.3 kg, 37.6 kg, 38.8 kg, 45.5 kg, 44.1 kg, 48.2 kg.
Approximately how many times heavier is a sumo wrestler compared to a ballet dancer?
Solution
Take the average weight of the sumo wrestlers:
(295.2 + 250.7 + 234.1 + 221.0 + 200.9) ÷ 5
= 1201.9 ÷ 5
= 240.38 kg
Take the average weight of the ballet dancers:
(40.3 + 37.6 + 38.8 + 45.5 + 44.1 + 48.2) ÷ 6
= 254.5 ÷ 6
= 42.42 kg
Now,
240.38 ÷ 42.42 ≈ 5.67
Therefore, a sumo wrestler is approximately 5.7 times heavier than a ballet dancer.
5.3 Visualising Data
Figure It Out
1. The following infographic shows the speeds of a few animals in air, on land, and in water. Can we call this graph a bar graph?
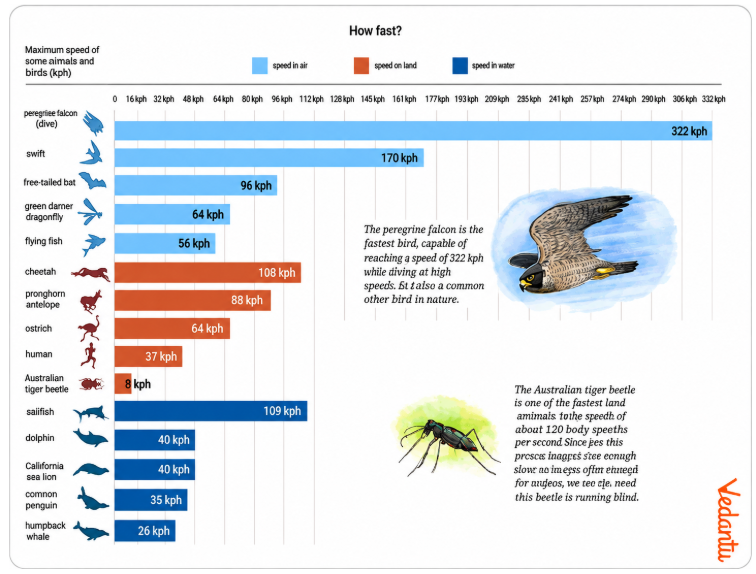
(a) What is the scale used in this graph?
(b) What did you find interesting in this infographic? What do you want to explore further?
(c) Identify a pair of creatures where one’s speed is about twice that of the other.
(d) Can we say that a sailfish is about 4 times faster than a humpback whale? Can we say that a sailfish is the fastest aquatic animal in the world?
Solution
(a) Scale: 1 unit length = 16 kilometres per hour.
(b) Do yourself.
(c) The speed of the green darner dragonfly (64 kph) is approximately twice the speed of the gentoo penguin (35 kph).
(d) Yes, we can say that a sailfish is about 4 times faster than a humpback whale, as the speed of a sailfish is 109 kph, which is about 4 times the speed of a humpback whale (26 kph).
∴ 26 × 4 = 104 kph
Yes, based on the given data, we can say that the sailfish is the fastest aquatic animal in the world.
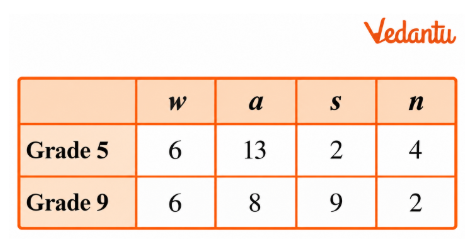
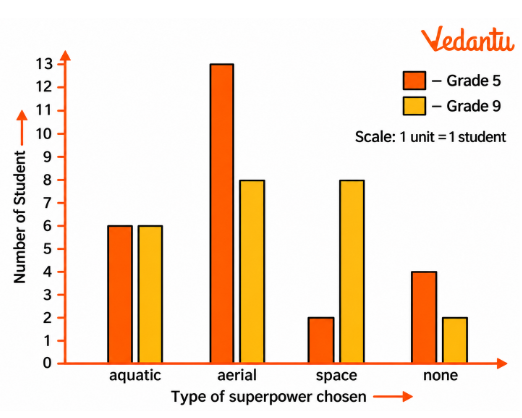
2. Preyashi asked her students ‘If you were to get a super power to become aquatic (water-borne), aerial (air-borne), or spaceborne which one would you choose?’. The responses are shown below. Some chose none. Draw a double-bar graph comparing how both grades chose each option. Choose an appropriate scale.
Solution
3. The temperature variation over two days in different months in Jodhpur, Rajasthan, is given below. Draw a double-bar graph. Use the scale 1 unit = 4°C. Can you guess which two months these days might belong to?
Solution
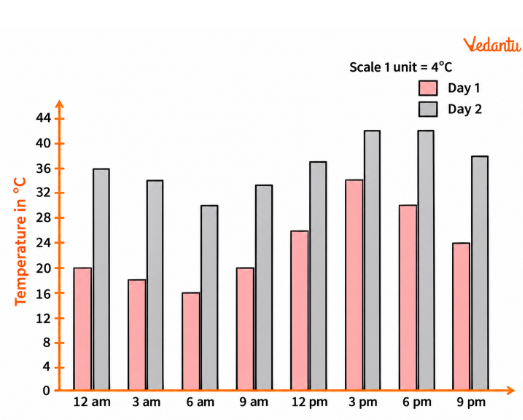
These days might belong to December and May.
4. The following clustered-bar graph shows the number of electric vehicles registered in some states every year from 2022 to 2024.
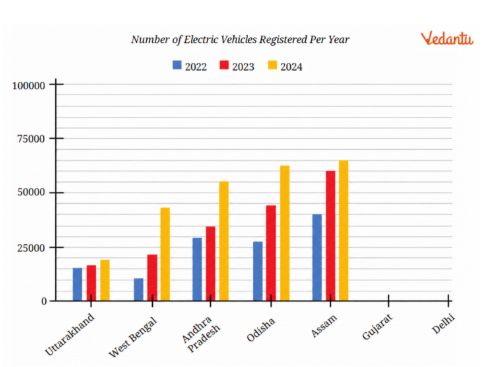
(a) The data (rounded off to thousands) for the states of Gujarat and Delhi are given in the table below. Mark the corresponding bars on the bar graph. (It is enough if you place the top of the bars between the two appropriate vertical guidelines.)
(b) Notice how the graph is organised, what scale is used, and what patterns the data shows.
(c) How would you describe the change for various states between 2022 and 2024?
(d) Approximately how many more registrations did Assam get in 2023 compared to 2022?
(e) How many times more did the registrations in West Bengal increase from 2022 to 2024?
(f) Is this statement correct — ‘There were very few new registrations in Uttarakhand in 2023 and 2024, as the increase in the bar lengths is minimal’?
Solution
(a)
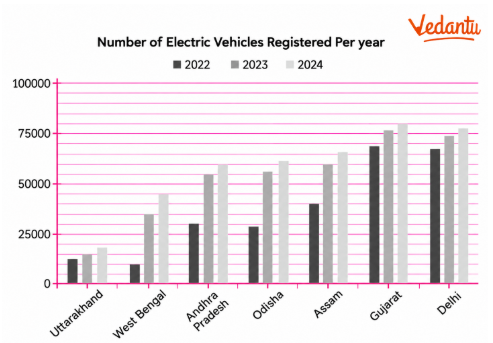
(b) Scale: 1 unit length = 25,000 electric vehicles
(c)
(i) Most of the states show an increasing trend in electric vehicle registrations from 2022 to 2024.
(ii) Delhi and Gujarat have the highest number of registrations among the states shown, while Uttarakhand has the lowest number of registrations.
(iii) Overall, vehicle registrations appear to increase year by year across most of the states.
(iv) Assam and Andhra Pradesh show significant growth in electric vehicle registrations.
(d) Registrations in Assam
In 2022 – 40,000 (approx)
In 2023 – 60,000 (approx)
More registrations = 60,000 – 40,000 = 20,000
Therefore, Assam has approximately 20,000 more registrations in 2023 compared to 2022.
(e) Registrations in West Bengal
In 2022 – 11,000 (Approx)
In 2024 – 44,000 (Approx)
More times registration = 44,000 + 11,000
Increase = 4 times
Therefore, registrations in West Bengal increased approximately four times from 2022 to 2024.
(f) The given statement is correct.
5.4 Data Detective
Figure It Out
1. The dot plots below show the distribution of the number of pockets on clothing for a group of boys and for a group of girls.
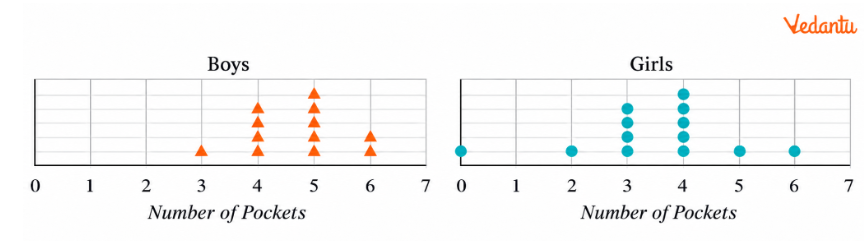
Based on the dot plots, which of the following statements are true?
(a) The data varies more for the boys than for the girls.
(b) The median number of pockets for the boys is more than that for the girls.
(c) The mean number of pockets for the girls is more than that for the boys.
(d) The maximum number of pockets for boys is greater than that for the girls.
Solution
(a) False
(b) True
(c) False
(d) True
2. The following table shows the points scored by each player in four games:
Now answer the following questions:
(a) Find the average number of points scored per game by A.
(b) To find the mean number of points scored per game by C, would you divide the total points by 3 or by 4? Why? What about B?
(c) Who is the best performer?
Solution
(a) Average number scored per game by A = Sum of points ÷ Number of games played
= (14 + 16 + 10 + 10) ÷ 4
= 50 ÷ 4
= 12.5
(b) To find the mean number of points scored per game by C, we divide the total points by 3 because player ‘C’ did not play game 3 and played only 3 games.
For player (B), we divide the total points by 4 because the player played all four games.
(c) Player ‘A’ is the best performer.
3. The marks (out of 100) obtained by a group of students in a General Knowledge quiz are 85, 76, 90, 85, 39, 48, 56, 95, 81 and 75. Another group’s scores in the same quiz are 68, 59, 73, 86, 47, 79, 90, 93 and 86. Compare and describe both the groups performance using, mean and median.
Solution:
Group 1: Number of students in the first group = 10
Sum of marks of the first group = 85 + 76 + 90 + 85 + 39 + 48 + 56 + 95 + 81 + 75 = 730
Mean = Sum of marks ÷ Number of students
= 730 ÷ 10
= 73
Arranging the marks in ascending order:
39, 48, 56, 75, 76, 81, 85, 85, 90, 95
Since there are 10 scores, which is an even number, the median is the average of the 5th and 6th scores.
Median = (76 + 81) ÷ 2
= 157 ÷ 2
= 78.5
Group 2: Number of students in the second group = 9
Sum of marks of the second group = 68 + 59 + 73 + 86 + 47 + 79 + 90 + 93 + 86 = 681
Mean = 681 ÷ 9
= 75.67
Arranging the scores in ascending order:
47, 59, 68, 73, 79, 86, 86, 90, 93
Since there are 9 scores, which is an odd number, the median is the 5th score.
Median = 79
4. Consider this data collected from a survey of a colony.
Choose an appropriate scale and draw a double-bar graph. Write down your observations.
Solution
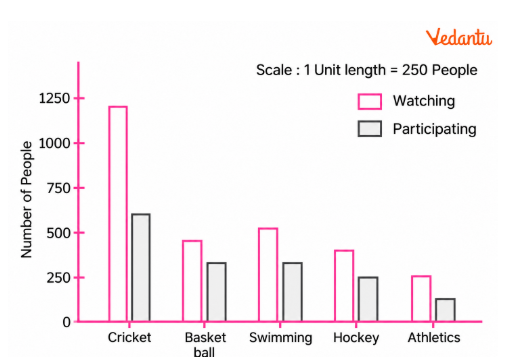
Cricket is the most popular sport for both watching and participating.
Across all categories, more people watch sports than participate in them.
Athletics has the lowest numbers for both watching and participating.
Basketball and swimming have similar participation numbers, but swimming is watched by more people than Basketball.
5. Consider a group of 17 students with the following heights (in cm): 106, 110, 123, 125, 117, 120, 112, 115, 110, 120, 115, 102, 115, 115, 109, 115, 101. The sports teacher wants to divide the class into two groups so that each group has an equal number of students: one group has students with height less than a particular height and the other group has students with heights greater than the particular height. Suggest a way to do this. Can you guess the age of these students based on the tabular data in the ‘Telling Tall Tales’ section?
Solution:
17 is an odd number, so it cannot be divided into two perfectly equal groups.
Arrange the heights of the students in increasing order:
101, 102, 106, 109, 110, 110, 112, 115, 115, 115, 115, 115, 117, 120, 120, 123, 125
Mean = (17 + 1) ÷ 2 term
= 9th term
= 115 cm
According to the conditions given in the question, the height used to divide the students into two groups should be:
112 < Height < 115
If we take 114 cm as the required height, then:
Group 1 (Less than 114 cm): 101, 102, 106, 109, 110, 112
Total = 7 students
Group 2 (More than 114 cm): 115, 115, 115, 115, 115, 117, 120, 120, 123, 125
Total = 10 students
6. Describe the mean and median of heights of your class. You can visualise the heights on a dot plot.
Solution:
Do yourself.
7. There are two 7th grade sections at a school. Each section has 15 boys and 15 girls. In one section, the mean height of students is 154.2 cm. From this information, what must be true about the mean height of students in the other section?
(a) The mean height of students in the other section is 154.2 cm.
(b) The mean height of students in the other section is less than 154.2 cm.
(c) The mean height of students in the other section is more than 154.2 cm.
(d) The mean height of students in the other section cannot be determined.
Solution
(d) The mean height of the students’ section cannot be determined.
8. Standing tall in the storm.
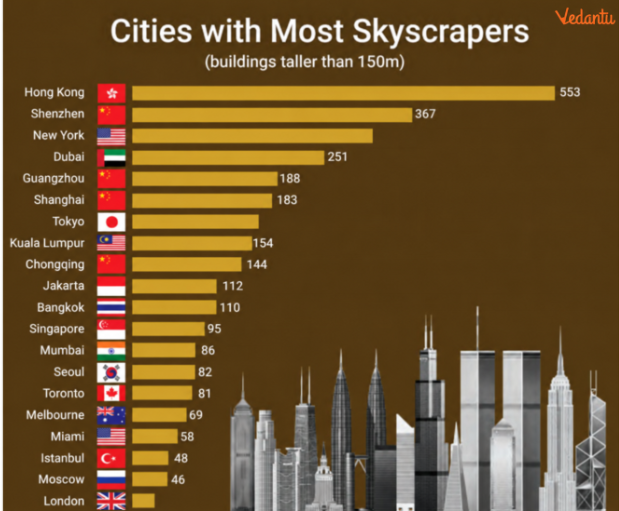
(a) Write estimated values for the number of skyscrapers in New York, Tokyo, and London.
(b) Are the following statements valid?
(i) Only 12 cities have more skyscrapers than Mumbai.
(ii) Only 7 cities have fewer skyscrapers than Mumbai.
(iii) The tallest building in the world is in Hong Kong.
Solution
(a) Estimated values for the number of skyscrapers in
New York – 38
Tokyo – 160
London – 305
(b) (i) Valid
(ii) Valid
(iii) Invalid
9. Estimate and then measure the objects listed in the following table. Draw a double bar graph based on the data. How accurate were your estimates? Find the average difference between the estimated and measured values.
Solution
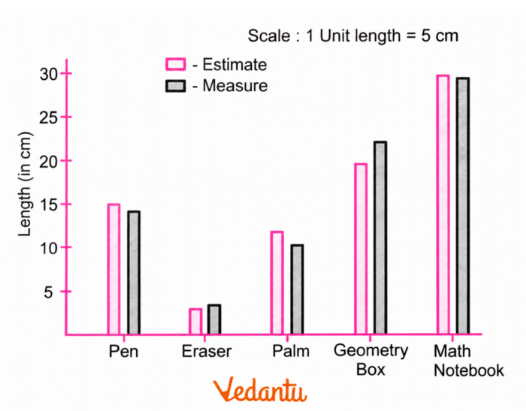
Sum of differences = 0.5 + (-0.6) + 1.5 + (-2.4) + 0.5 = -0.5
Average difference = -0.5 ÷ 5
= -0.1 cm
Estimated values are 0.1 cm less than the actual values on average.
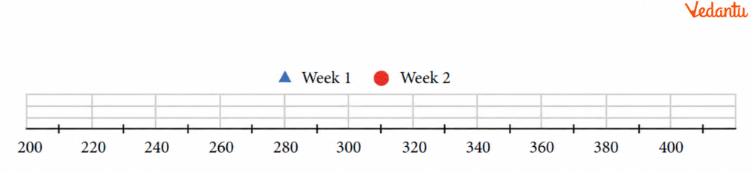
10. Aditi likes solving puzzles. She recently started attempting the ‘Easy’ level Sudoku puzzles. The time she took (in seconds) to solve these puzzles are — 410, 400, 370, 340, 360, 400, 320, 330, 310, 320, 290, 380, 280, 270, 230, 220, 240. The first nine values correspond to Week 1 and the rest to Week 2.

(a) Construct a dot plot below showing the data for both weeks.
(b) Describe the mean, median, and any observations you may have about the data.
Solution
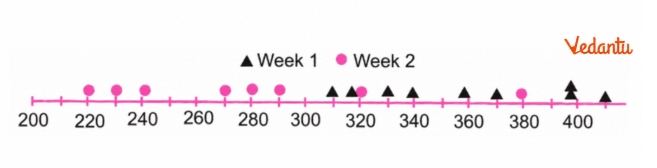
Mean = Sum of values / Total number of values
= (410 + 400 + 370 + 340 + 360 + 400 + 320 + 330 + 310 + 320 + 290 + 380 + 280 + 270 + 230 + 220 + 240) / 17
= 5470 / 17
= 321.76 ≈ 321 sec.
Arranging in ascending order:
220, 230, 240, 270, 280, 290, 310, 320, 320, 330, 340, 360, 370, 380, 400, 400, 410
With 17 values, the median is the 9th value.
So median = 320 sec
11. Individual Project: Pick at least one of the following:
(a) How Long is a Sentence? Pick any two textbooks from different subjects. Choose any page with a lot of text from each book.
(i) Use a dot plot to describe how many words the sentences have on each page.
(ii) Compare the data of both the pages using mean and median.
(b) What is in a Name? Write down the names of all of your classmates. The following are some interesting things you can do with this data!
(i) Find the mean and median name length (number of letters in a name).
(ii) Visualise the data and describe its variability and central tendency.
(iii) Which starting letters are more popular? Which are less popular?
(iv) What is the median starting letter? What does this say about the number of names starting with the letters A – M and N – Z?
(v) Plot a double-bar graph showing the number of boys’ names and girls’ names that:
• start and end with vowels,
• start with vowels and end with consonants,
• start with consonants and end with vowels,
• start and end with consonants.
Solution
Do yourself.
12. Individual project (long term): This requires collecting data over 2 weeks or more.
In and Out: Track how many times you step out of your house in a day. Do this for a month.
(i) Describe the variability and central tendency of this data. Make a dot plot.
(ii) Do you find anything interesting about this data? Share your observations.
(iii) You can ask any of your family members or friends to do this as well.
Solution
Do yourself.
13. Small-group project: Pick at least one of the following. Make groups of 8 to 10. Collect data individually as needed. Put together everyone’s data and do the appropriate analysis and visualisation.
(a) Our heights vs. our family’s heights: Collect the heights of your family members.
(i) Make a dot plot showing heights of just your family members. Describe its variability and central tendency.
(ii) Make a double-bar graph showing each student’s height next to their family’s mean height.
(iii) Look at everyone’s data and share your observations.
(b) Estimating time: Check the time and close your eyes. Open them when you think 1 minute has passed (no counting). Note down after how many seconds you opened your eyes. Collect this data for yourself and for your family members. Repeat this activity to estimate 3 minutes.
(i) Make two dot plots (for 1 minute and 3 minutes) showing estimates of just your family members.
(ii) Mark these on the respective dot plots. Describe its variability and central tendency.
(iii) Make a double bar graph showing each family’s mean 1 minute estimate and mean 3 minute estimate.
(iv) Look at everyone’s data and share your observations.
Solution
Do yourself.
Key Benefits of Vedantu’s NCERT Solutions for Class 7 Maths Chapter 5 (Ganita Prakash II)
Vedantu’s NCERT solutions for Class 7 Maths Chapter 5 provide clear, step-by-step explanations for the chapter's questions.
The solutions help students understand the correct method, not just check the final answer.
Students can use the chapter solutions for homework support, regular practice, and quick revision before school exams.
The NCERT solutions for Class 7 Maths Chapter 5 PDF make it easier to revise important questions and concepts whenever needed.
Simple explanations help students identify mistakes and improve their problem-solving approach.
Use Vedantu’s solutions alongside the NCERT textbook to strengthen chapter understanding and build confidence in Maths.
Important Study Material Links for Chapter 5: Connecting the Dots…
NCERT Solutions for Class 7 Maths Ganita Prakash I and II (New Syllabus)
Important Related Links for NCERT Class 7 Maths
FAQs on NCERT Solutions for Class 7 Maths Chapter 5 Connecting the Dots | 2026-27
1. How can NCERT solutions for Class 7 Maths Chapter 5 (Ganita Prakash II) help students?
The solutions help students understand each question through clear steps and simple explanations. They help with homework, practice, revision, and checking answers after students attempt the questions independently.
2. What is the purpose of the NCERT solutions for Class 7 Maths Chapter 5 PDF?
The PDF gives students a convenient, chapter-wise study resource they can use while practising textbook questions or revising key concepts before tests and exams.
3. Are Vedantu’s CBSE NCERT solutions for Class 7 Maths Chapter 5 useful for exam preparation?
Yes. Vedantu’s solutions help students revise the chapter systematically, understand the correct solving methods, and practise presenting answers clearly for school examinations.
4. When should students use the NCERT Maths solutions for Class 7 Chapter 5 (Ganita Prakash II)?
Students can use the solutions after attempting the textbook questions themselves. They can then compare their answers, understand mistakes, and review any steps they found difficult.
5. Can students use the NCERT solutions for Class 7 Maths Chapter 5 PDF for revision?
Yes. The PDF format supports quick, organised revision, especially when students want to revisit solved questions and key methods from the chapter.
6. Why should students refer to Vedantu’s NCERT solutions for Class 7 Chapter 5 Maths?
Vedantu provides student-friendly explanations that focus on understanding the method behind each solution. This makes the resource useful for regular learning, clarifying doubts, practising, and exam revision.