


Smart Charts - Exercise-wise Questions and Answers For Class 4 Maths - Free PDF Download
Welcome to Class 4 Maths Chapter 14 - "Smart Charts"! Get ready to dive into the world of charts and graphs. In this exciting chapter, you'll learn how to represent information visually, making it easier to understand. Explore the power of smart charts as you embark on a fun and colourful math adventure! The experienced teachers and subject matters at Vedantu have developed NCERT Solutions for Class 3 Maths Chapter 14 -- Smart Charts. The entire solution has been developed as per the latest CBSE syllabus. Every solution is easily available on Vedantu's official website, and you can download the PDF format by clicking on the link. You can choose any subject and revise your topics at your own pace. If you have any questions, you can reach out to our teachers through our website.
 Table of Content
NCERT Solutions for Class 4 Maths Chapter 14 – Smart Charts teaches us how to handle data. The concept of handling data is a very important area in Maths. We are always organizing things. We organize our books, wardrobe, timetable, etc. So things are always placed in an organized way. By the end of primary school, students must be able to collect and record data and present it in the form of bar charts, pie charts, and tables. Children must be able to master the topic and draw inferences.
1. How many hours?
All of us enjoy watching television or listening to the radio.
How much time do we spend on this?
Ans: We spend one hour every day watching television.
Note the time you spend in front of a TV or radio every day. Do this for one week. The time spent in a week is ______ hours.
Ans: The time spent on TV in a week is seven hours.
So in a month you spend about 30 × ____ = ____ hours.
Ans: For the given relation they have assumed that we watch TV for 30 days in a month. So in a month you spend about
$30\times 1=30\text{ hours}$
2. Find out from your friends the time they spend in a week.
Ans: I talked to my friends to know about the time they spend in a week watching television or listening to the radio. The table below shows the data I recorded.
3. From the table (Watching TV/ listening to the radio) above answer the following.
____ children spend more than 6 hours in a week.
Ans: From the table above, 30 children spend more than 6 hours watching TV or listening to the radio in a week.
____ children spend no time at all.
Ans: Twenty children spend no time.
Most children spend ____ hours in a week.
Ans: Most children spend 15 hours in a week.
____ children spend more than 3 hours.
Ans: 105 children spend more than 3 hours.
4. Which Programme?
There are different types of programmes on TV or radio such as cartoons, news, sports, music, plays, serials. Juhi’s father likes watching serials. Her mother likes sports. Juhi likes news programmes.
Ask people in your family to name one programme they like and one programme they dislike. Make a table.
The kind of programme most family members like ____
The kind of programme most family members dislike ____
Ans: My family members like and dislike these programmes that are shown in the table below.
The kind of programme most family members like is movies and cartoons.
The kind of programme most family members dislike is serials and news.
5. Find out from 20 friends the programmes they like and dislike, and write in a table.
Ans: I found from 20 friends the programmes which they like and dislike.
6. Answer the following questions using the table in the above question.
Which kind of programme is liked by most children?
Ans: Cartoons are liked by 20 children and Comedy shows are liked by 17 children so cartoons and comedy shows are the programmes which are liked by most children.
Which kind of programme is disliked by the least number of children?
Ans: Cartoons and Comedy shows are the programmes which are disliked by the least number of children.
How many children like sports programmes?
Ans: Nine children like sports programmes.
Is there any kind of programme not liked by anyone? Yes/ No. If yes, which one? _____.
Ans: No. All the programmes are liked by at least one child.
7. Read the poem given below carefully and answer these questions:
Who is my friend?
I’ve a friend with me always,
In the nights and through the days.
When I run he runs with me,
Sometimes I lead, sometime he.
When it’s dark he can’t be seen,
Do you know which friend I mean?
Which word comes most often in the poem?
Ans: The letter I come most often in the poem.
Which letter has been used most?
Ans: The letter E has been used the most in the given poem.
Which letter comes least?
Ans: The letters, ‘B’ and ‘V’ come least in the poem.
8. Take a paragraph you like from your language textbook. Read carefully and find out:
There are 4 houses on his land and in the middle of the land there is a well. He wants to divide this land equally among his four children. Each should get one house and be able to use the well without entering the other’s land.
Which word comes most often and how many times? ____
Ans: The word ‘land’ is used most often and it is used four times in the paragraph.
Which word comes least often? ____
Ans: The words, ‘are’, ‘on’ etc. come least often in the paragraph.
The letter used most often is ____
Ans: The letter ‘E’ is used most often in the paragraph. It is used 26 times.
The letter used least often is ____
Ans: The letters used least often are ‘F’, ‘Q’, ‘V’ and ‘Y’. These letters are used only one time.
9. Food We Eat: Children were talking about what things they eat in the morning — made of rice, wheat, maize, barley, etc. Find out from your classmates and fill the table:
Ans: The table is completed as follows after asking the friends.
10. Look at the above table and tell:
Most children eat food made from ____.
Ans: 30 students eat food made from maize. So, most children eat food made from maize.
Compared to children who eat rice, those who eat wheat are more/ less/ equal.
Ans: Compared to children who eat rice, those who eat wheat are less.
Compared to those who eat wheat, children eating ragi are more/ less.
Ans: 10 children eat wheat and eight children eat ragi. Thus, compared to those who eat wheat, children eating ragi are less.
11. Preparing for the Class Drama: All children of a class are getting ready for a drama. Some children are acting. Some are busy collecting dresses. Some are bringing tables and chairs to make the sets.
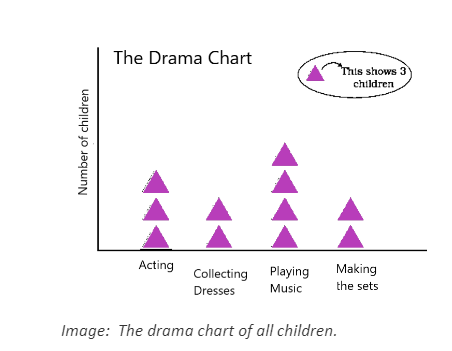
How many children are acting in the drama?
Ans: From the graph above, we can see that there are three triangles which represent the children doing acting and each triangle represents three children. So, a total of 9 children are acting in the drama.
Which are more – children making the sets or those acting?
Ans: From the graph above, we can see that there are three triangles which represent the children doing acting and each triangle represents three children. Similarly, there are two triangles which represent the children making sets. Thus, 9 children are doing acting and 6 children are making the sets. Therefore, the number of children doing acting is more.
What is being done by most of the children?
Ans: The children doing music are represented by 4 triangles. We can see that the children doing music have the maximum triangles. Thus, most of the children are playing music.
How many children are collecting dresses?
Ans: 6 children are collecting dresses.
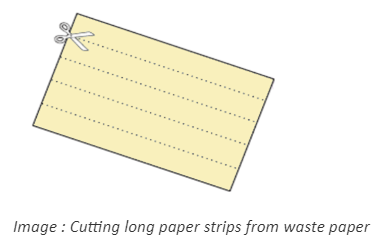
12. Whose Head is Bigger? Cut long paper strips from waste paper. Give one strip to each of your friends. Now put the paper strip around your head and tear off the extra strip. On a big sheet, paste these paper strips along a line.
Some children had pasted their strips and made a chart like this.
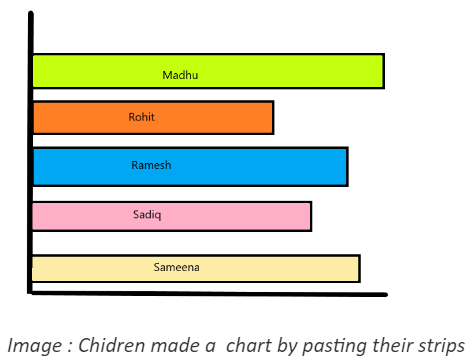
Your chart should also look like this. Use a scale and find out from your chart:
Ans: The strips of my friend’s head are pasted in the chart given below.
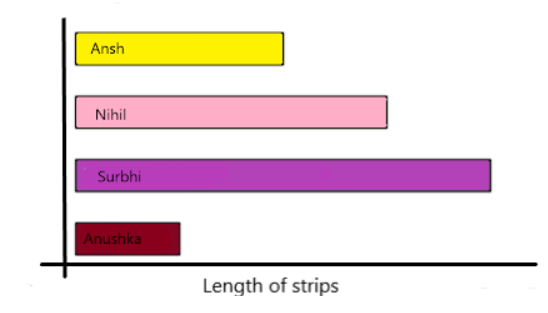
The length of the longest strip is ____ cm.
Ans: The length of the longest strip is 50 cm.
So _____ has the biggest head.
Ans: Surbhi has the biggest head.
The smallest strip is ____ cm long. It belongs to ____.
Ans: The smallest strip is 25 cm long. It belongs to Anushka.
13. All children of a school take part in different clubs: The Chapati Chart shows the number of children in different clubs.
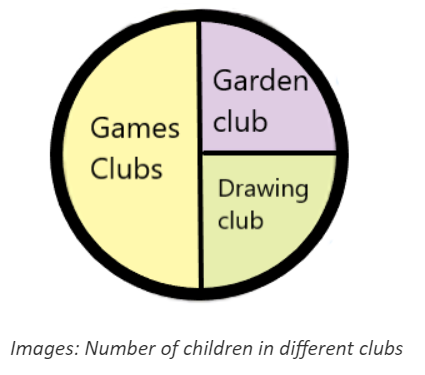
Half the children in the class take part in the Games Club. One fourth of the children are members of the Garden Club. The Drawing Club has one fourth of the children of the class. If there are 200 students in the school, look at the above Chapati Chart and tell the number of members in each club:
1. The Games Club has ____ members.
Ans: The Games Club has half of the total members. We know that half of 200 is 100. So, The Games Club has 100 members.
2. The Garden Club has ____ members.
Ans: The Garden Club has one fourth of the total members. Thus, $\dfrac{1}{4}\times 200=50$. Therefore, The Garden Club has 50 members.
3. There are ____ members in the Drawing Club.
Ans: The Drawing Club has one fourth of the total members. Thus, $\dfrac{1}{4}\times 200=50$. There are 50 members in the Drawing Club.
14. Getting Wet in the Rain: Who likes to get wet in the rain? A child made this Chapati Chart after asking his friends.
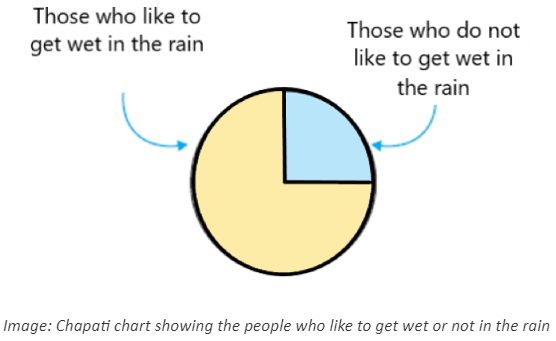
See the Chapati Chart and tell:
How many children like to get wet in the rain?
(a) half (b) one-fourth (c) three-fourth
Ans: From the chart, we can observe that three-fourth of the children like to get wet in the rain.
How many children do not like to get wet in the rain?
(a) half (b) one-fourth (c) three-fourth
Ans: From the chart, we can observe, one-fourth of the children do not like to get wet in the rain.
15. If the number of children in the class is 28, then tell the number of children according to the given conditions.
Who likes to get wet in the rain?
Ans: Three-fourth of the children like to get wet in the rain. So, $\dfrac{3}{4}\times 28=21$. Thus, 21 children like to get wet in the rain.
Who does not like to get wet in the rain?
Ans: One-fourth of the children do not like to get wet in the rain. So, $\frac{1}{4}\times 28=7$. Thus, 7 children do not like to get wet in the rain.
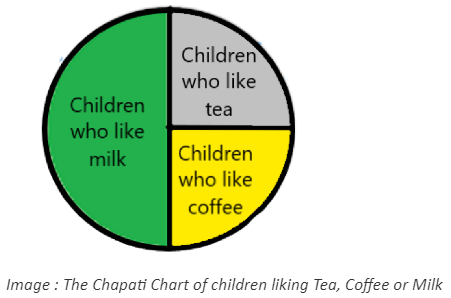
16. Tea, Coffee or Milk: Some children were asked which of these they liked most – Tea, Coffee or Milk.
What is the total number of children?
Ans: To find the total number of children, we will add all the numbers of the right hand side column. Thus, $20+10+10=40$. Therefore, the total number of children is 40.
17. Find out from the table:
i. Children who like milk are $\dfrac{1}{2}$ or $\dfrac{1}{4}$ of the total children.
Ans: 20 children like milk. Total number of children is 40. So, the children who like milk are $\dfrac{20}{40}$ , that is, $\dfrac{1}{2}$. Therefore, the children who like milk are $\dfrac{1}{2}$ of the total children.
ii. Children who like coffee are $\dfrac{1}{2}$ or $\dfrac{1}{4}$ of the total children.
Ans: Children who like coffee are $\dfrac{1}{4}$ of the total children.
iii. Show the liking for Tea, Coffee or Milk in a Chapati Chart.
Ans: The Chapati Chart of children liking Tea, Coffee or Milk are given below.
NCERT Solutions for Class 4 Maths Chapter 14 Smart Charts
Observation
The first thing and the most key aspect of handling data are observing things around us. This means that we need to keep our eyes and ears open when we look at objects in our surroundings. Observation is very essential in order to collect information about anything. If we don’t observe properly then we can miss out on some important aspects and our recording of the information will be incomplete. For example, if we have to keep a record of programs that come on TV and who in the family likes to watch which program then we have to observe our family members for a certain number of days.
How Do We Classify Things?
Classifying things means collecting information and then grouping them as per the analysis. Basically, we are arranging the information based on its attributes. In simple words, we are collecting information and organizing them. For example, a librarian organizes the books as per their demand or we organize our books as per the timetable.
Data Handling
Data Handling is the process of collection, organization, and analysis of data and finally its representation with the help of graphs and pie charts.
Uses of Data Handling
We use data handling almost all things in our daily life.
Doctors keep records of their patients.
Recording of water levels in the river.
Librarians keep a record of books borrowed or returned.
Teachers keep a record of student’s performance in the class.
Parents keep a record of household expenses.
In this lesson, we learn three ways of keeping records.
Creating tables
Bar Charts
Pie Charts
1. Creating Tables
Creating tables is also called a frequency distribution table. It helps us make a better understanding of the data given. However, tables are not useful when we have to keep a record of large data.
(Image to be added soon)
In the above picture, we are keeping a record of how many children are taking different methods of travelling. If we have to keep a record of a larger amount of information then we can use a tally frequency distribution table like the picture below.
(Image to be added soon)
2. Bar Graph
A bar graph is a graphical representation that is used to represent simple data by using uniform rectangle bars. The width of the rectangle bars always remains the same, only the length or the height of the bars changes. The length of the bar depicts a value. We use bar graphs when we want to compare a few things or if we want to show how many times something is changed over a certain time.
(Image to be added soon)
In the above bar graph, we are keeping a record of how many fruits are there in a basket in the form of a bar graph. We draw an L-shaped line. We name them the x-axis and y-axis. On the x-axis, we write the name of the fruits and on the y-axis, we mark the values of the fruits, and then according to the values on the y-axis we draw the bars.
3. Pie Chart
A pie chart is a pictorial circular chart that is divided into slices to represent data. We divide the chart into slices just as we make slices in a pizza. Let us look at the pie chart below. We are representing the data on how many children take different methods of travelling in the form of a pie chart.
(Image to be added soon)
Chapter Summary - Smart Charts
In Class 4 Maths Chapter 14, "Smart Charts," students dive into the fascinating world of charts. The chapter introduces the art of creating and understanding charts in an engaging manner. It emphasizes clear explanations for each concept, promoting a deep understanding of the subject. The content is presented in a structured and easy-to-follow format, aiding comprehension. Accurate answers aligned with the curriculum boost students' confidence. Visual aids such as diagrams simplify complex ideas, and additional tips enhance overall performance. Chapter summaries facilitate quick revision, while online accessibility and downloadable resources provide flexibility for effective study and revision.
What are the Benefits of using Vedantu’s NCERT Solutions for Class 4 Maths?
Key Features of NCERT Solutions, These solutions are designed to help students achieve proficiency in their studies. They are crafted by experienced educators who excel in teaching class 4 Maths. Some of the features include:
1. Simple Explanations: The solutions for Class 4 Maths Chapter 14 - "Smart Charts" provide easy-to-understand explanations for each question. This makes it simpler for you to grasp the concepts and learn more about smart charts.
2. Clear and Organized Layout: Everything is neatly arranged, making it easy to follow and learn. Imagine it's like having a tidy room where everything has its own place, so you can find what you need quickly.
3. Right Answers: The solutions give you the correct answers that match what you learn in class. This helps you feel sure about what you know, boosting your confidence in smart chart knowledge.
4. Helpful Pictures: There are pictures and drawings to make tricky ideas easy to understand. It's like having colourful maps to guide you through the land of smart charts.
5. Useful Tips: You get extra tips and tricks to do even better. It's like having a secret code that makes solving smart chart puzzles more exciting and fun.
6. Quick Summaries: There are short summaries to quickly remember what you learned. It's like a little reminder of all the cool things about smart charts.
7. Online Access and Downloads: You can use them online or download them. It's like having your smart chart guide always with you, whether you're at home or somewhere else.
Conclusion
NCERT Solutions are key for Class 4 exam preparation. First, read your textbook chapter thoroughly. Then, tackle NCERT questions in Class 4 Maths Chapter 14 - Smart Charts. Find detailed solutions on Vedantu, aligned with CBSE guidelines. Download free NCERT Solutions to guide your exam prep with expert-reviewed answers.
This lesson teaches a vital math skill: data handling. We use it in our daily lives to organize books, wardrobes, timetables, and toys. Learning to observe, collect information, and draw conclusions is crucial. This builds the foundation for higher classes, helping students understand the importance of record-keeping.
Other Study Material for CBSE Class 4 Maths Chapter 14
Chapter-Specific NCERT Solutions for Class 4 Maths
CBSE Class 4 Maths Study Materials

FAQs on NCERT Solutions For Class 4 Maths Chapter 14 Smart Charts - 2025-26
1. What are NCERT Solutions for Class 4 Maths Chapter 14 Smart Charts?
NCERT Solutions for Class 4 Maths Chapter 14 Smart Charts provide step-by-step answers to all questions in the 'Smart Charts' chapter, following the CBSE 2025–26 syllabus. They help students learn how to handle, organize, and represent data using tables, bar graphs, and pie charts.
2. How do you solve questions on bar graphs in Class 4 Maths Chapter 14?
To solve bar graph questions in Class 4 Maths Chapter 14, follow these steps:
- Read the question and identify what data is represented.
- Examine the axes: the x-axis usually shows categories (like fruits), and the y-axis shows numbers.
- Look at the height of each bar to find the value for that category.
- Answer based on the bar heights and the question asked.
3. What is a frequency distribution table as per NCERT Solutions for Class 4 Maths Chapter 14?
A frequency distribution table helps organize data by showing how many times each value occurs. For example, it can display how many children like each type of food or program. It makes large data sets easier to interpret.
4. How does data handling help in real life according to Class 4 Maths Chapter 14?
Data handling helps in real life by allowing us to collect and organize information for better decision-making. For example, keeping track of time spent watching TV, students’ performance in class, or recording household expenses.
5. Why is observation important in data handling in Smart Charts (Class 4 Maths Chapter 14)?
Observation ensures that the data collected is accurate and complete. In Smart Charts, careful observation means you won’t miss important details, leading to correct recording and better analysis of information as per NCERT guidelines.
6. What is the difference between a bar graph and a pie chart in Class 4 Maths Chapter 14?
- Bar graph: Uses rectangular bars of equal width; the length shows the value. Best for comparing numbers across categories.
- Pie chart: A circular chart divided into slices, each representing a part of the whole. Ideal for showing proportion or percentages.
7. How does Class 4 Maths Chapter 14 help in building foundational math skills?
Chapter 14 develops critical skills such as organizing, classifying, and interpreting data. These foundational skills are essential for understanding more advanced math topics in future classes, supporting logical and analytical thinking.
8. What common mistakes should be avoided while solving NCERT Solutions for Smart Charts?
Common mistakes to avoid:
- Misreading data from charts or graphs.
- Not checking labels and units on axes.
- Incorrectly grouping or counting items in frequency tables.
- Assuming proportions without calculating.
9. How can NCERT Solutions for Class 4 Maths Chapter 14 enhance exam preparation?
These solutions align with CBSE 2025–26 patterns and provide detailed, accurate answers. Using them helps students:
- Practice step-wise problem solving.
- Understand marking scheme expectations.
- Address common exam questions and improve confidence.
10. In Smart Charts, what is the importance of summarising data after collection?
Summarising data helps students quickly identify patterns, spot trends, and draw simple conclusions, simplifying further analysis as taught in Class 4 Maths Chapter 14 NCERT Solutions.
11. What kinds of questions are solved using NCERT Solutions for Class 4 Maths Chapter 14?
The solutions cover questions such as:
- Reading and interpreting data from tables.
- Drawing and analysing bar graphs and pie charts.
- Answering questions on data collection, organization, and representation.
- Applying concepts to real-life situations.
12. Why is it important to use only CBSE-prescribed solutions like Vedantu’s NCERT Solutions for Chapter 14?
CBSE-prescribed solutions ensure students learn using the correct methods and formats as expected in exams. This maximises scoring, avoids confusion, and ensures coverage of all syllabus points for the 2025–26 academic year.
13. How does grouping data help in Smart Charts (Class 4 Maths Chapter 14)?
Grouping data helps in sorting and simplifying large information sets so students can easily compare, analyse, and understand results using tables, graphs, or charts, as per the chapter requirements.
14. What should you do if a bar graph in the NCERT question has missing values?
Check if the missing value can be calculated using the total given, or look for patterns in the data. Sometimes, a question may ask for estimation or to identify errors, testing your understanding of chart reading.
15. How can working on Smart Charts benefit students in other subjects?
Learning to handle and interpret data is a universal skill useful in science, social studies, and even daily life. Mastering Smart Charts in Class 4 Maths helps build confidence in reading data and making informed decisions.