


Why Is the Key Important in Mathematics?
Have you ever seen the traffic lights? What does each light mean? Each has a specific meaning. Red—Stop, Yellow—Ready to Go, and Green—Go. These are the ‘keys’ to specify the meaning of each light. Probably, we all learn about it in our school. Here, ‘keys’ are the meaning of the symbol written somewhere to understand the symbols.

Traffic Lights
In Mathematics, keys have the same meaning, but it is usually written with their symbol.
Key—Maths Definition
Keys are the meaning of the symbols used in a graph or map. Keys are also called ‘legend’. Keys are written along with the graph or map. In other words, a key includes the variables or objects used in the chart or graph along with an example (symbol) of what they look like.
Key in Graph
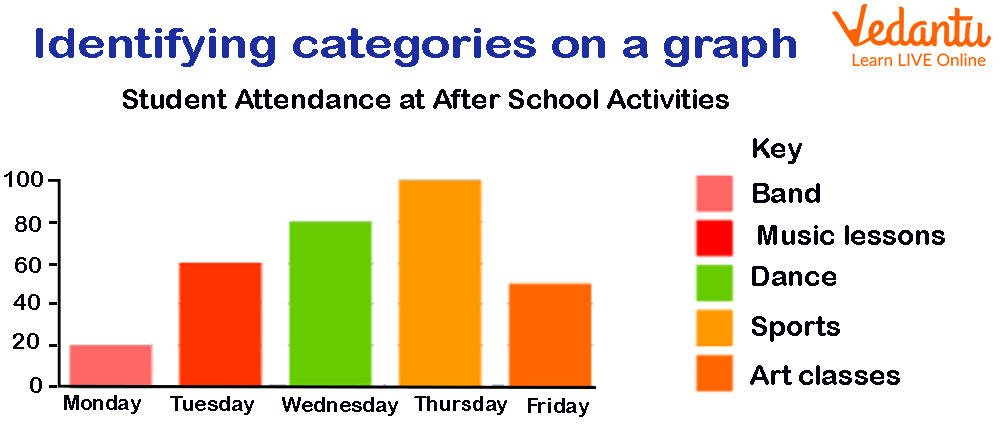
Keys are necessary to use with any graph to make the meaning of the graph clearer. Here is an example of students' activities after school.
Key Meaning in Mathematics
In the above-given graph, students attend different activities after school. We can see each day there are different activities. Pink represents ‘Band’. It tells us that on Monday, 20 students attend the ‘Band’ session. Similarly, on Tuesday, Wednesday, Thursday, and Friday, 60 students attend the ‘Music Lessons’ activity, 80 students attend the ‘Dance’ activity, 100 students attend the ‘Sports’ activity, and 50 students attend the ‘Art Classes’ activity, respectively.
Without keys, we are unable to identify the significance of using different colours. Isn’t it?
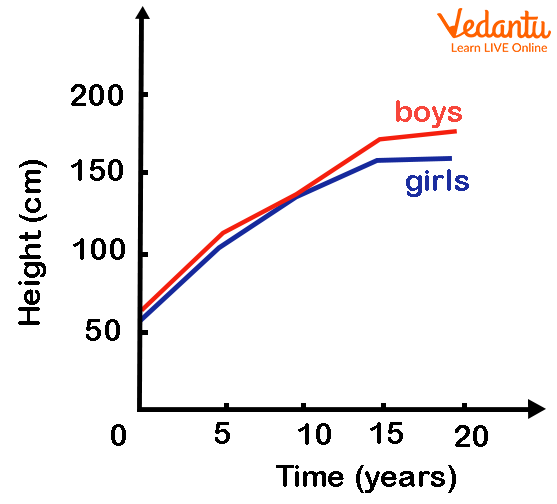
To understand it more, here we will consider an example of a line chart.
Key Usage in Line Chart
In the above figure of a line chart, time is given along the X-axis while height (in cm) is given along the Y-axis. As the age increases, the height of a child increases. In the blue colour line, how the height of a girl increases over time is represented by the blue colour whereas the red colour line shows the change in height of a boy over years. By that, we concluded that the age of a boy increases with a higher proportion than a girl. So, the representation of the meaning of each colour is known as ‘Key’.
What if the key is not given? We could not conclude the result as we might have a question about why two lines are given or what each line represents. Isn't it?
Keys in Maps
Keys in maps are very useful to identify the places. A person who draws maps is called a cartographer.
Here, a map is given. In the map, a key or legend is given on the right side.
In this map of Mistry Falls Park, different obstacles are given along with some related information. While roaming here and there, in need of anything or to decide what path to follow, we can simply look at the map and the keys or legend provided to mark their location.
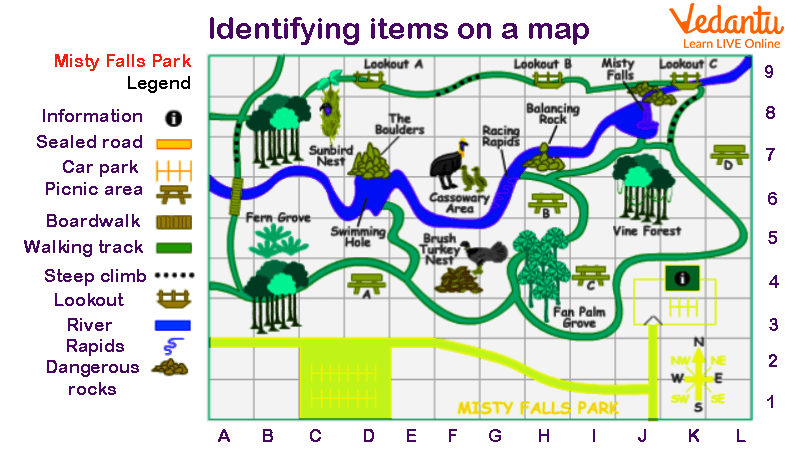
Keys used in Map
Conclusion
We have learnt what a key or legend is. Keys are very useful as they make the meaning of a graph or chart clearer. In maps, it is necessary to use the keys else a person might get confused about what he found next in his path.
To know more about Mathematical terms, explore our website.
FAQs on Key in Maths: Definition and Examples
1. What is the meaning of a 'key' in mathematics?
In mathematics, a key, also known as a legend, is a small box of information that explains the meaning of the symbols, colours, or patterns used in a graph, chart, or map. It acts like a dictionary, allowing you to correctly interpret the visual data presented. For example, in a pictograph about apple sales, the key might state that one apple symbol represents 10 apples sold.
2. Why is a key so important when reading a graph or a chart?
A key is crucial because it provides context to the data. Without a key, a graph is just a collection of shapes and colours with no clear meaning. The key translates these visual elements into understandable information. It ensures that anyone reading the graph can accurately understand what is being measured and compared, preventing misinterpretation of the data.
3. Can you give some examples of where a key is used in maths?
A key is most commonly used in the 'Data Handling' or 'Statistics' sections of mathematics. Here are a few examples:
- Pictographs: The key shows what number of items each picture or symbol represents.
- Bar Graphs: When a graph compares multiple categories (e.g., sales in different years), the key uses colours or patterns to show which bar corresponds to which category.
- Pie Charts: The key explains what each coloured or shaded slice of the pie represents.
- Maps: A map key explains what different symbols stand for, such as a star for a capital city or a blue line for a river.
4. Is there a difference between a 'key' and a 'legend' on a graph?
In the context of mathematics and data visualisation, there is no significant difference between a 'key' and a 'legend'. Both terms are used interchangeably to refer to the explanatory box that decodes the symbols and colours on a chart or graph. 'Legend' is a more formal term, but 'key' is widely understood and used, especially in school-level mathematics.
5. How is a graph's key different from its scale?
A key and a scale on a graph serve two very different purposes.
- The key explains 'what' the data represents. It links symbols, colours, or patterns to categories (e.g., a blue bar represents 'Boys' and a red bar represents 'Girls').
- The scale explains 'how much'. It is the set of numbers along an axis (usually the y-axis) that shows the quantity or measurement being used (e.g., each line represents an increase of 5 students).
6. What information should you include when creating a key for a graph?
When creating a key for a graph, you must include two essential pieces of information for each data category:
- A small sample of the symbol, colour, or pattern used in the graph.
- A clear, concise text label that describes exactly what that symbol or colour represents.
7. Where is the key usually located on a chart or map?
The key is typically placed in a clear, unobtrusive position where it doesn't overlap with the data itself. Most often, you will find the key located in a box on the right-hand side of the graph. Other common locations include the bottom of the graph or sometimes the top-left or top-right corner, depending on the layout and available space.