


What is the z value for a 90, 95, and 99 percent confidence interval?
Answer
531.6k+ views
Hint: We need to know how to calculate the area under the curve for the given z value using the formula $A=\dfrac{1+CL}{2}.$ Here, A represents the area under the normal distribution curve and CL represents the confidence level. We then get the corresponding area. Using this area value, we look up the normal distribution table for the corresponding row and column and add the two to obtain the z value.
Complete step-by-step solution:
Let us consider the first case for which the given confidence level is 90 percent. In this case, we need to calculate the area under the curve and it can be given as shown in the figure below.
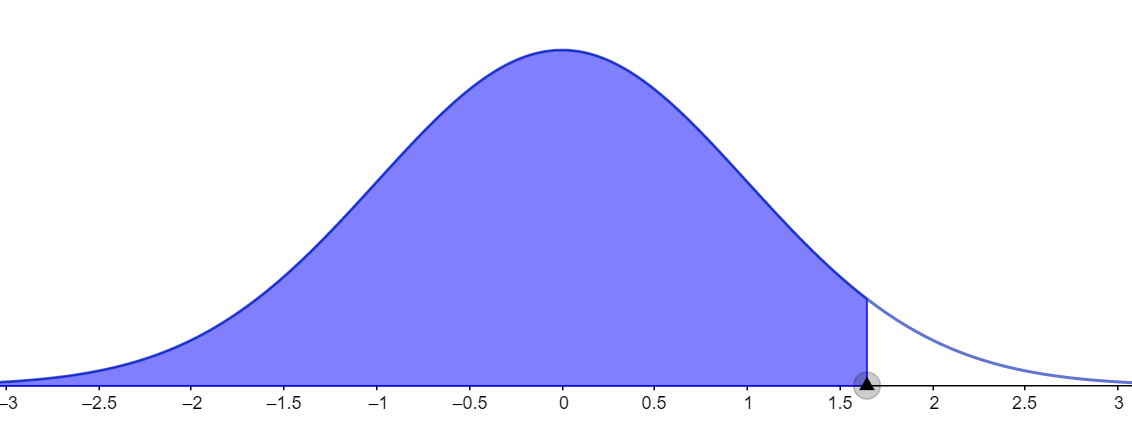
It can be calculated by using the formula $A=\dfrac{1+CL}{2}.$ Here, A represents the area under the normal distribution curve and CL represents the confidence level. Substituting the CL value as 0.90, we get
$\Rightarrow A=\dfrac{1+0.90}{2}$
Adding and dividing by 2,
$\Rightarrow A=\dfrac{1.9}{2}=0.95$
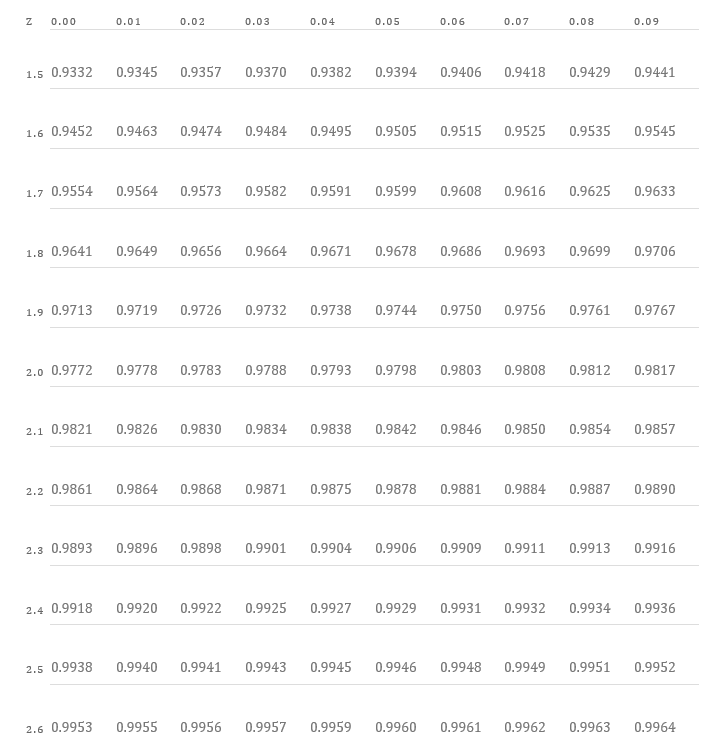
Looking for this value in the normal distribution table given below, we can see that this value lies close to the row containing 1.6 and column containing 0.05. It also lies close to the row containing 1.6 and column containing 0.04. So, we take a mean of these values to obtain the z value at this point.
$\Rightarrow \dfrac{1.64+1.65}{2}=1.645$
Hence, the z value at the 90 percent confidence interval is 1.645.
Let us consider the second case for which the given confidence level is 95 percent. In this case, we need to calculate the area under the curve and it can be given as shown in the figure below.
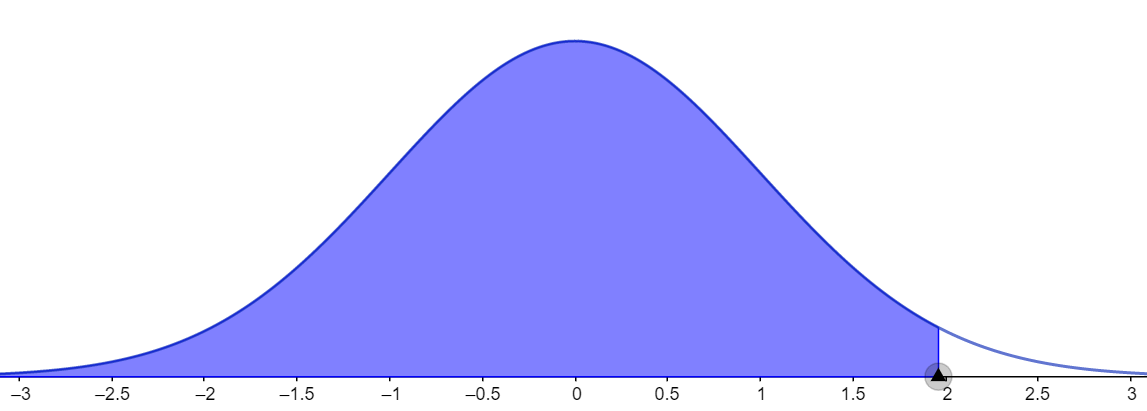
It is calculated by using the formula $A=\dfrac{1+CL}{2}.$ Substituting the values,
$\Rightarrow A=\dfrac{1+0.95}{2}$
Adding and dividing by 2,
$\Rightarrow A=\dfrac{1.95}{2}=0.975$
Looking for this value in the normal distribution table given above, we can see that this value lies on the row containing 1.9 and column containing 0.06. Adding the two values,
$\Rightarrow 1.9+0.06=1.96$
Hence, the z value at the 95 percent confidence interval is 1.96.
Let us consider the third case for which the given confidence level is 99 percent. In this case too, we need to calculate the area under the curve and it can be given as shown in the figure below.
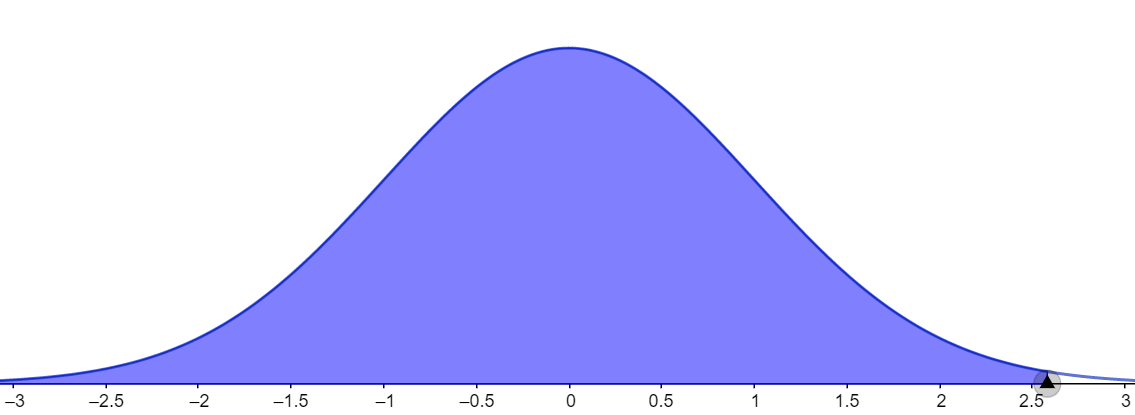
It is calculated by using the formula $A=\dfrac{1+CL}{2}.$ Substituting the values,
$\Rightarrow A=\dfrac{1+0.99}{2}$
Adding and dividing by 2,
$\Rightarrow A=\dfrac{1.99}{2}=0.995$
Looking for this value in the normal distribution table given above, we can see that this value lies on the row containing 2.5 and column containing 0.08. Adding the two values,
$\Rightarrow 2.5+0.08=2.58$
Hence, the z value at the 99 percent confidence interval is 2.58.
Note: : It is important to take care while noting down the z value from the table, since it can be confusing and it is common to make errors while reading data from a table usually. It is important to know the concept of probability and statistics to solve this question.
Complete step-by-step solution:
Let us consider the first case for which the given confidence level is 90 percent. In this case, we need to calculate the area under the curve and it can be given as shown in the figure below.
It can be calculated by using the formula $A=\dfrac{1+CL}{2}.$ Here, A represents the area under the normal distribution curve and CL represents the confidence level. Substituting the CL value as 0.90, we get
$\Rightarrow A=\dfrac{1+0.90}{2}$
Adding and dividing by 2,
$\Rightarrow A=\dfrac{1.9}{2}=0.95$
Looking for this value in the normal distribution table given below, we can see that this value lies close to the row containing 1.6 and column containing 0.05. It also lies close to the row containing 1.6 and column containing 0.04. So, we take a mean of these values to obtain the z value at this point.
$\Rightarrow \dfrac{1.64+1.65}{2}=1.645$
Hence, the z value at the 90 percent confidence interval is 1.645.
Let us consider the second case for which the given confidence level is 95 percent. In this case, we need to calculate the area under the curve and it can be given as shown in the figure below.
It is calculated by using the formula $A=\dfrac{1+CL}{2}.$ Substituting the values,
$\Rightarrow A=\dfrac{1+0.95}{2}$
Adding and dividing by 2,
$\Rightarrow A=\dfrac{1.95}{2}=0.975$
Looking for this value in the normal distribution table given above, we can see that this value lies on the row containing 1.9 and column containing 0.06. Adding the two values,
$\Rightarrow 1.9+0.06=1.96$
Hence, the z value at the 95 percent confidence interval is 1.96.
Let us consider the third case for which the given confidence level is 99 percent. In this case too, we need to calculate the area under the curve and it can be given as shown in the figure below.
It is calculated by using the formula $A=\dfrac{1+CL}{2}.$ Substituting the values,
$\Rightarrow A=\dfrac{1+0.99}{2}$
Adding and dividing by 2,
$\Rightarrow A=\dfrac{1.99}{2}=0.995$
Looking for this value in the normal distribution table given above, we can see that this value lies on the row containing 2.5 and column containing 0.08. Adding the two values,
$\Rightarrow 2.5+0.08=2.58$
Hence, the z value at the 99 percent confidence interval is 2.58.
Note: : It is important to take care while noting down the z value from the table, since it can be confusing and it is common to make errors while reading data from a table usually. It is important to know the concept of probability and statistics to solve this question.
Recently Updated Pages
Master Class 11 Computer Science: Engaging Questions & Answers for Success
Master Class 11 Business Studies: Engaging Questions & Answers for Success
Master Class 11 Economics: Engaging Questions & Answers for Success
Master Class 11 English: Engaging Questions & Answers for Success
Master Class 11 Maths: Engaging Questions & Answers for Success
Master Class 11 Biology: Engaging Questions & Answers for Success
Trending doubts
One Metric ton is equal to kg A 10000 B 1000 C 100 class 11 physics CBSE
There are 720 permutations of the digits 1 2 3 4 5 class 11 maths CBSE
Discuss the various forms of bacteria class 11 biology CBSE
Draw a diagram of a plant cell and label at least eight class 11 biology CBSE
State the laws of reflection of light
Explain zero factorial class 11 maths CBSE