


The marks obtained by 200 students in an examination are given below:
Marks 0-10 10-20 20-30 30-40 40-50 50-60 60-70 70-80 80-90 90-100 No. of Students 05 10 11 20 27 38 40 29 14 06
Using a graph paper, draw an Ogive for the above distribution. Use your Ogive to estimate:
(i) The Median.
(ii) The number of students who obtained more than 80% marks in the examination.
(iii) The number of students who did not pass if the pass percentage was 35.
Use the scale as: 2 cm = 10 marks on one axis, and
2 cm = 20 students on the other.
| Marks | 0-10 | 10-20 | 20-30 | 30-40 | 40-50 | 50-60 | 60-70 | 70-80 | 80-90 | 90-100 |
| No. of Students | 05 | 10 | 11 | 20 | 27 | 38 | 40 | 29 | 14 | 06 |
Answer
568.8k+ views
Hint: Ogive graph: An Ogive graph, also called a cumulative frequency polygon, is a type of frequency polygon that shows the cumulative frequencies. In other words, the cumulative percentages are added on the graph from left to right.
An Ogive graph plots cumulative frequency on the y-axis and class boundaries along the x-axis. It’s very similar to a histogram, only instead of rectangles, an Ogive has a single point marking. It is easier to create this kind of graph from a cumulative frequency table.
Cumulative Frequency: A cumulative frequency distribution is the sum of the frequencies of all classes below it in a frequency distribution.
Median: Median is the value at the central position when the data is arranged in ascending or descending order.
Formula used
For an n number of observations:
For, odd n, median is the value at the $\left(\dfrac{n+1}{2}\right)$ position.
For even n, median is the mean of values at $\left(\dfrac{n}{2}\right)$ and $\left(\dfrac{n}{2}+1\right)$ position.
Median (Estimated) in a Grouped Data = $L+\dfrac{\left( \tfrac{n}{2} \right)-B}{G}\times w$ .
L is the lower class boundary of the group containing the median.
n is the total number of values.
B is the cumulative frequency of the groups before the median group.
G is the frequency of the median group.
w is the group width.
Complete step-by-step answer:
Let us first make the cumulative frequency table for the given distribution.
Let us now plot it on a graph with the x-axis representing the marks and the y-axis representing the number of students (cumulative frequency).
(i) The Median:
For 200 students, the median will be the mean of the scores of students at $\dfrac{200}{2}$ = 100th and $\dfrac{200}{2}+1$ = 101st position.
From the above graph, we can see that the students from 74th position onwards till the 111th position, got a score in the range 50-60.
∴ Both the 100th and 101st students got a score of 50-60.
In order to estimate the median, we will use the formula: Median = $L+\dfrac{\left( \tfrac{n}{2} \right)-B}{G}\times w$ .
Here, L = 50, n = 200, B = 73, G = 38 and w = 10.
∴ Median = $50+\dfrac{\left( \tfrac{200}{2} \right)-73}{38}\times 10=50+\dfrac{100-73}{38}\times 10=50+\dfrac{270}{38}=57.10$ .
(ii) The number of students who obtained more than 80% marks in the examination.
Using the graph, we can see that 180 students got a score of less than 80. Therefore, the number of students who got a score of more than 80% = 200 - 180 = 20.
(iii) The number of students who did not pass if the pass percentage was 35.
From the graph, we can see that 26 students got 30 or less and 46 students got a score of 40 or less. So, we can only conclude that more than 26 but less than 46 students definitely failed.
Note: Grouped data are formed by combining individual observations of a variable into groups, so that a frequency distribution of these groups serves as a convenient means of summarizing or analyzing the data.
Grouped data is given in class intervals and their frequencies.
For a grouped data, we cannot find the exact Mean, Median and Mode, we can only give estimates.
The central values (mid-points) of the class intervals are used to estimate the Mean.
e.g. 0-10 ⇒ central value is 5; 10-20 ⇒ central value is 15; etc.
An Ogive graph plots cumulative frequency on the y-axis and class boundaries along the x-axis. It’s very similar to a histogram, only instead of rectangles, an Ogive has a single point marking. It is easier to create this kind of graph from a cumulative frequency table.
Cumulative Frequency: A cumulative frequency distribution is the sum of the frequencies of all classes below it in a frequency distribution.
Median: Median is the value at the central position when the data is arranged in ascending or descending order.
Formula used
For an n number of observations:
For, odd n, median is the value at the $\left(\dfrac{n+1}{2}\right)$ position.
For even n, median is the mean of values at $\left(\dfrac{n}{2}\right)$ and $\left(\dfrac{n}{2}+1\right)$ position.
Median (Estimated) in a Grouped Data = $L+\dfrac{\left( \tfrac{n}{2} \right)-B}{G}\times w$ .
L is the lower class boundary of the group containing the median.
n is the total number of values.
B is the cumulative frequency of the groups before the median group.
G is the frequency of the median group.
w is the group width.
Complete step-by-step answer:
Let us first make the cumulative frequency table for the given distribution.
| Marks | 0-10 | 10-20 | 20-30 | 30-40 | 40-50 | 50-60 | 60-70 | 70-80 | 80-90 | 90-100 |
| No. of Students | 05 | 10 | 11 | 20 | 27 | 38 | 40 | 29 | 14 | 06 |
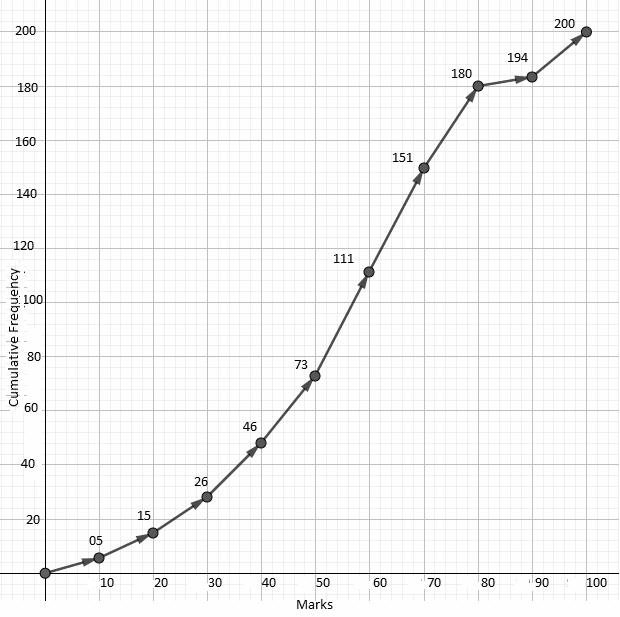
| Cumulative Frequency | 05 | 15 | 26 | 46 | 73 | 111 | 151 | 180 | 194 | 200 |
Let us now plot it on a graph with the x-axis representing the marks and the y-axis representing the number of students (cumulative frequency).
(i) The Median:
For 200 students, the median will be the mean of the scores of students at $\dfrac{200}{2}$ = 100th and $\dfrac{200}{2}+1$ = 101st position.
From the above graph, we can see that the students from 74th position onwards till the 111th position, got a score in the range 50-60.
∴ Both the 100th and 101st students got a score of 50-60.
In order to estimate the median, we will use the formula: Median = $L+\dfrac{\left( \tfrac{n}{2} \right)-B}{G}\times w$ .
Here, L = 50, n = 200, B = 73, G = 38 and w = 10.
∴ Median = $50+\dfrac{\left( \tfrac{200}{2} \right)-73}{38}\times 10=50+\dfrac{100-73}{38}\times 10=50+\dfrac{270}{38}=57.10$ .
(ii) The number of students who obtained more than 80% marks in the examination.
Using the graph, we can see that 180 students got a score of less than 80. Therefore, the number of students who got a score of more than 80% = 200 - 180 = 20.
(iii) The number of students who did not pass if the pass percentage was 35.
From the graph, we can see that 26 students got 30 or less and 46 students got a score of 40 or less. So, we can only conclude that more than 26 but less than 46 students definitely failed.
Note: Grouped data are formed by combining individual observations of a variable into groups, so that a frequency distribution of these groups serves as a convenient means of summarizing or analyzing the data.
Grouped data is given in class intervals and their frequencies.
For a grouped data, we cannot find the exact Mean, Median and Mode, we can only give estimates.
The central values (mid-points) of the class intervals are used to estimate the Mean.
e.g. 0-10 ⇒ central value is 5; 10-20 ⇒ central value is 15; etc.
Recently Updated Pages
Master Class 10 Computer Science: Engaging Questions & Answers for Success
Master Class 10 General Knowledge: Engaging Questions & Answers for Success
Master Class 10 English: Engaging Questions & Answers for Success
Master Class 10 Social Science: Engaging Questions & Answers for Success
Master Class 10 Maths: Engaging Questions & Answers for Success
Master Class 10 Science: Engaging Questions & Answers for Success
Trending doubts
Which women's tennis player has 24 Grand Slam singles titles?
Who is the Brand Ambassador of Incredible India?
Why is there a time difference of about 5 hours between class 10 social science CBSE
The Equation xxx + 2 is Satisfied when x is Equal to Class 10 Maths
Which Country is Called "The Land of Festivals"?
What is Contraception List its four different methods class 10 biology CBSE