


What is a sub divided bar diagram?
Draw a sub divided bar diagram from the following data?
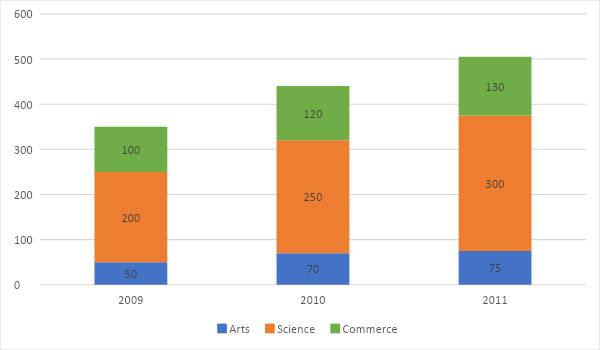
Stream Number of students 2009 2010 2011 Arts 50 70 75 Science 200 250 300 Commerce 100 120 130
| Stream | Number of students | ||
| 2009 | 2010 | 2011 | |
| Arts | 50 | 70 | 75 |
| Science | 200 | 250 | 300 |
| Commerce | 100 | 120 | 130 |
Answer
552.3k+ views
Hint: We first explain the process of creating the chart for a sub-divided bar diagram. The components get represented in a single bar. The representation can also be represented as total stacked.
Complete step by step solution:
A sub-divided bar diagram is used to present the data having 2 or more common components. Subdivided or component bar chart is used to represent data in which the total magnitude is divided into different components.
The two main components for our given problem are year and stream.
We represent the years along X-axis and the streams along Y-axis.
The streams for a single year will be represented in a single bar divided by respective percentages.
The blue coloured parts represent the arts section, brown coloured parts represent the science section and green coloured parts represent the commerce section.
Note:
We always represent the components according to the fractional value or the percentage value. The full stacked representation is also where the total value is the same for all the main components.
Recently Updated Pages
Master Class 10 Computer Science: Engaging Questions & Answers for Success
Master Class 10 General Knowledge: Engaging Questions & Answers for Success
Master Class 10 English: Engaging Questions & Answers for Success
Master Class 10 Social Science: Engaging Questions & Answers for Success
Master Class 10 Maths: Engaging Questions & Answers for Success
Master Class 10 Science: Engaging Questions & Answers for Success
Trending doubts
What is the median of the first 10 natural numbers class 10 maths CBSE
Which women's tennis player has 24 Grand Slam singles titles?
Who is the Brand Ambassador of Incredible India?
Why is there a time difference of about 5 hours between class 10 social science CBSE
Write a letter to the principal requesting him to grant class 10 english CBSE
A moving boat is observed from the top of a 150 m high class 10 maths CBSE