


Distance-Time and Velocity-Time Graphs Explained with Examples
The graphical representation of motion is a vital concept in Physics, helping students visualize how objects move by using motion graphs and formulas. Explore the types of motion graphs, their interpretations, derivations, and key formulas, while also seeing real-world examples and essential questions for exams. Dive into this guide to master motion graphs for Class 9, Class 11, and beyond.
Understanding the Graphical Representation Of Motion
In Physics, motion describes how an object’s position changes with respect to time and a reference point. Motion can be complex, but the graphical representation of motion simplifies this by letting us “see” relationships like distance, displacement, velocity, and acceleration with easy-to-interpret graphs. These visual tools, such as the distance-time graph and velocity-time graph, are essential for analyzing different scenarios, including uniform and non-uniform motion. Whether solving graphical representation of motion class 9 questions with answers or preparing for competitive exams, mastering these graphs is crucial.
Why Motion Graphs Matter in Physics
Graphs provide a quick and effective way to display how physical quantities interact. In the context of motion, we generally plot the dependent variable (like distance or velocity) on the y-axis and the independent variable (usually time) on the x-axis. The slope and shape of these “motion graphs—physics” reveal if an object is stationary, in uniform motion, or accelerating. Understanding these plots supports both conceptual understanding and quick calculation of speed, velocity, and acceleration. It also prepares students to tackle graphical representation of motion class 9th assignments, motion graph worksheets, and analytical questions found in many assessments.
Types of Motion Graphs: Distance-Time, Displacement-Time, and Velocity-Time
1. Distance-Time Graph
A distance-time graph shows how far an object travels over time. The slope at any point represents the object’s speed. Let’s look at both uniform and non-uniform motion:
Uniform Speed (Straight Line)
If an object moves at a constant speed (covers equal distances in equal times), its distance-time graph is a straight line starting at the origin. This is often covered in graphical representation of motion class 9 pdf resources and graphical representation of motion distance time graph exercises.
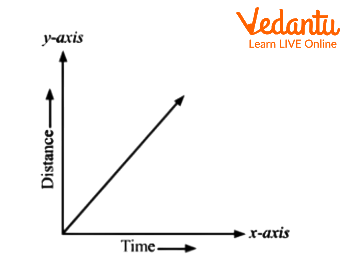
In this type of motion graph, the formula for speed is simply the slope: Speed Formula: $\text{Speed} = \dfrac{\text{Change in distance}}{\text{Change in time}}$
Non-Uniform Speed (Curved Line)
When an object’s speed varies, the distance-time graph becomes a curve. This curve indicates acceleration, which is essential for understanding graphical representation of motion equations and types of motion graphs used in advanced classes.
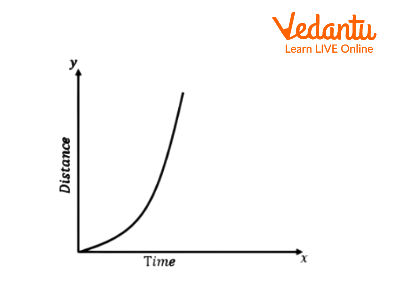
A steeper curve shows speeding up, while a flattening curve means the object is slowing down. For more on distinguishing between these, see Uniform and Non-Uniform Motion.
2. Displacement-Time Graph
A displacement-time graph represents the shortest distance (displacement) between the starting and ending points over time. The slope of this plot reveals velocity. If the line is straight and parallel to the x-axis, the object is at rest. A straight sloped line means constant velocity, while a curved line signals changing velocity (acceleration). This type is fundamental in graphical representation of motion class 11 and conceptual motion graph questions.
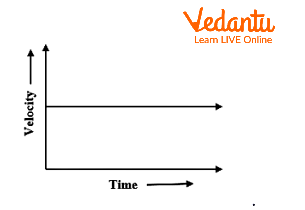
3. Velocity-Time Graph
Velocity-time graphs map how an object’s velocity changes over time. Here:
- A horizontal line means uniform velocity (no acceleration).
- An inclined (sloped) line indicates constant acceleration or deceleration (retardation).
- The area under the graph equals the total displacement.
These velocity-time plots are frequently encountered in graphical representation of motion velocity time graph assignments and motion equations.
For a deeper dive, visit Distance-Time Graphs Explained.
Essential Motion Graph Formulas
Understanding the following key formulas will boost your ability to analyze motion graphs and answer related questions:
- Speed: $\text{Speed} = \frac{\text{distance}}{\text{time}}$
- Velocity: $\text{Velocity} = \frac{\text{displacement}}{\text{time}}$
- Acceleration: $a = \frac{\Delta v}{\Delta t}$, where $\Delta v$ is change in velocity
- Displacement from Velocity-Time Graph: $\text{Displacement} = \text{Area under velocity-time graph}$
These motion graph formulas help easily perform calculations without needing to memorize every motion equation separately; a key benefit of the graphical representation of motion worksheet and calculator approaches.
Deriving Physics Quantities from Motion Graphs
Let’s break down how key motion parameters are found using the slope and area in these graphs, crucial for mastering Graphical REPRESENTATION of motion ppt questions.
- On a distance-time graph, calculate the speed as the slope: $v = \frac{\Delta s}{\Delta t}$
- On a displacement-time graph, the slope gives velocity: $v = \frac{\Delta x}{\Delta t}$
- On a velocity-time graph, the slope gives acceleration: $a = \frac{\Delta v}{\Delta t}$
- Area under velocity-time graph equals displacement: $s = v \times t$ (if velocity is constant) or the area of triangle/trapezium for varying velocity.
Motion Graphs in Action: Sample Problems and Solutions
Applying these concepts in problems is key for graphical representation of motion class 9 questions with answers and motion graph examples. Here are two solved examples:
-
Example 1: An object completes half a revolution along a circle of radius $7\,\text{cm}$. What is the distance covered?
Solution:
Circumference = $2\pi r$, so half revolution equals $\pi r$. Calculation: $= \pi \times 7 = 22\,\text{cm}$. -
Example 2: A car reduces its speed from $22\,\text{m/s}$ to $16\,\text{m/s}$ in $5$ seconds. Determine its acceleration.
Solution (using motion formula): $a = \frac{v - u}{t} = \frac{16 - 22}{5} = -1.2\,\text{m/s}^2$
For more practice, check Class 9 Motion MCQs and test your knowledge of distance and displacement from graphs.
Quick Reference Table: Motion Graph Quantity Overview
| Graph Type | Slope Represents | Area Under Graph |
|---|---|---|
| Distance-Time Graph | Speed | Not applicable |
| Displacement-Time Graph | Velocity | Not applicable |
| Velocity-Time Graph | Acceleration | Displacement |
Referencing this table will reinforce your understanding of which motion graph formula or calculation to use for any problem type.
Interesting Insights & Real-Life Applications
Graphical representation is not just for exams; it makes motion analysis in real life intuitive. Speedometers demonstrate instantaneous speed (distance-time principle), while area-under-curve analyses enable engineers to calculate distances using only velocity records. Understanding these basics will also make it easier to follow advanced Physics concepts such as average speed vs. average velocity or delve into kinematics and kinetics.
Conclusion: Mastering the Graphical Representation Of Motion
The graphical representation of motion transforms abstract concepts into clear, visual information, making it easier to interpret distance, velocity, and acceleration. From graphical representation of motion questions in class 9th and class 11 to equations and real-world uses, motion graphs equip you with critical analytical skills. To deepen your Physics journey further, explore more on motion and its principles or try additional problems from graphical representation of motion worksheets and examples.


FAQs on Graphical Representation of Motion for Class 9 Students
1. What is graphical representation of motion?
A graphical representation of motion visually shows how an object’s position, velocity, or acceleration changes over time. This is commonly done using three main types of graphs:
- Distance-time graph - shows how distance varies with time
- Velocity-time graph - shows changes in velocity over time
- Acceleration-time graph - shows acceleration against time
2. What is a distance-time graph?
Distance-time graphs represent how an object’s distance from a starting point changes with time. They show motion visually, making it easier for students to understand:
- A straight, sloped line means constant speed.
- A horizontal line shows no movement (stationary).
- A curved line represents accelerated motion.
3. How do you interpret a velocity-time graph?
A velocity-time graph shows how velocity changes over time for an object. To interpret it:
- A straight, horizontal line means constant velocity.
- An inclined straight line indicates uniform acceleration.
- The area under the graph gives the displacement of the object.
4. What does the slope of a distance-time graph indicate?
The slope of a distance-time graph indicates the speed of the moving object. The steeper the slope, the higher the speed; a zero slope indicates no movement. For CBSE exams, remember:
- Slope = Speed = (Change in Distance)/(Change in Time)
- A straight line with constant slope = uniform motion
- A changing slope = non-uniform motion
5. What information does the area under a velocity-time graph provide?
The area under a velocity-time graph gives the displacement of the object during the time interval. This is calculated as:
- For straight-line graphs: Area = Length × Width
- For sloped lines (triangular areas): calculate the geometric area
6. What is the difference between uniform and non-uniform motion on a graph?
On a distance-time graph, uniform motion is shown as a straight line with constant slope, while non-uniform motion is a curve or a line with changing slope. Key points:
- Uniform motion: constant speed, straight line
- Non-uniform motion: changing speed, curved line
7. How can we find acceleration from a velocity-time graph?
The slope of a velocity-time graph represents the acceleration of the object. To find it:
- Calculate Slope = (Change in Velocity) / (Change in Time)
- A constant slope means uniform acceleration
- A changing slope means non-uniform acceleration
8. What are the uses of graphical representation of motion?
The graphical representation of motion helps to visually understand and analyze motion. Key uses include:
- Describing types of motion (uniform, non-uniform)
- Calculating speed, velocity, and acceleration
- Predicting motion behaviour
- Simplifying complex numerical questions
- Useful for CBSE exam preparation
9. What is a displacement-time graph?
Displacement-time graphs plot an object’s displacement from a reference point against time. Important points for students:
- A straight line indicates constant velocity
- A curved line shows changing velocity
- A horizontal line means the object has not changed its position
10. Why are graphical methods important in studying motion?
Graphical methods make it easier to analyze and interpret motion in physics. They allow students to:
- Quickly visualize changes in motion over time
- Easily compare object speeds, velocities, and accelerations
- Extract important data without complex calculations
11. What does a horizontal line on a velocity-time graph indicate?
A horizontal line on a velocity-time graph shows that the object is moving at a constant velocity. This means:
- No acceleration is occurring
- Speed and direction remain unchanged
12. How do you calculate speed from a distance-time graph?
To calculate speed from a distance-time graph, measure the slope of the line:
- Speed = (Change in Distance) / (Change in Time)
- Constant slope = constant speed
- Changing slope = changing speed