


Class 9 Social Science Chapter 9 The Price Puzzle: What Drives the Market Solutions
The Big Questions
Question 1. What are the factors that influence the demand and supply of goods and services in a market?
Answer: Demand depends on factors such as the price of a product, consumers’ income, prices of related goods, preferences, population, season, and expectations about future prices. Supply is affected by the product’s price, production costs, technology, number of sellers, availability of inputs, and future expectations. Together, these factors influence how much consumers want to buy and how much producers are ready to sell.
Question 2. How are prices of goods and services determined through demand and supply interactions?
Answer: Prices are influenced by the balance between demand and supply. When buyers want more goods than sellers can provide, prices generally rise. When sellers have more goods than buyers want, prices tend to fall. The price at which quantity demanded matches quantity supplied is called the equilibrium price.
Question 3. What is market equilibrium, and does it exist in the real world?
Answer: Market equilibrium occurs when the quantity consumers want to buy is equal to the quantity sellers want to offer. Although this balance may occur in real markets, it is not permanent because demand and supply keep changing with factors such as income, weather, technology, and consumer preferences.
Question 4. How and why does the government intervene in the market?
Answer: The government may intervene to protect consumers and producers, control unfair market practices, and promote public welfare. It can regulate prices, prevent hoarding and black marketing, control monopolistic practices, and provide essential goods and public services when markets alone may not ensure fair access.
Let’s Explore
Question 1. Create your own demand schedule for buying notebooks at different prices. At what price would you buy the most? At what price would you stop buying altogether? What could be the reason behind your choices? (Page No. 200)
Answer:
I would purchase the most notebooks at ₹30 because the lower price makes them more affordable. At ₹100, I would avoid buying them because the price is too high. I would also consider factors such as quality and the number of pages before purchasing. This example shows the usual relationship between price and quantity demanded: as the price falls, people tend to buy more.
Question 2. Ask your family members if they postponed or preponed buying any product because of future expectations of changes in price? (Page No. 200)
Answer: Yes. My family once delayed purchasing a television because we expected festive-season discounts. They decided to wait for a lower expected price before making the purchase. This shows how expectations about future prices can influence present buying decisions.
Question 3. What happens to the supply of a product in case of a change in the cost of inputs, discovery of an alternate input, depletion of resources, change in weather, disaster, etc.? Discuss in class using examples of diverse goods and services. (Page No. 203)
Answer: Changes in production conditions can either increase or decrease supply. Higher input costs usually reduce supply, while cheaper or alternative inputs can make production easier and increase supply. Similarly, favourable weather may improve agricultural supply, whereas floods, droughts, or resource depletion can reduce it. For example, heavy rainfall may damage vegetable crops, reducing their market supply and pushing prices upward.
Question 4. From your surroundings, list two goods or services that are provided by the government (for example: roads, streetlights, parks, police, and so on). Choose one of the goods you listed and answer:
(i) Who benefits from it?
(ii) Why would it be difficult for a private company to provide this service on its own?
(iii) Imagine the government stops providing this good or service; what problems might people in your area face? (Page No. 207)
Answer: Goods/Services: Roads and streetlights.
(i) People living and travelling in the area benefit from these services.
(ii) Providing such services mainly for profit can be difficult because they are meant for the wider community, including people who may not directly pay for them.
(iii) Without these services, people could face poor connectivity, unsafe roads, inadequate lighting, traffic difficulties, and a higher risk of accidents.
Think About It
Question 1. What happens when you consume the first mango? It tastes delicious, right? The second one is good? The third one and so on? You are barely interested in eating mangoes by this point. Why do you think this happens? (Page No. 199)
Answer: The first mango usually provides a high level of satisfaction, but each additional mango may give less satisfaction than the previous one. This is known as diminishing marginal utility. As a person becomes more satisfied, the additional benefit from consuming another mango decreases, so their willingness to pay for another mango may also fall.
Question 2. Can you think of another real-life example (other than hotels) where prices change frequently? Explain why the prices keep changing. (Page No. 205)
Answer: Vegetables are a good example. Their prices can change frequently because their availability depends on the season, weather, harvest, transportation, and consumer demand. A poor harvest can reduce supply and increase prices, while a plentiful harvest can increase supply and bring prices down.
Question 3. Our choices today affect future resources. For example, high demand for fast fashion, overfishing, and overuse of groundwater can harm future supply. So, should we focus only on short-term gains, or also think about long-term sustainability? How could this affect the market equilibrium? (Page No. 205)
Answer: We should consider both present needs and long-term sustainability. Excessive use of resources can reduce their future availability. If future supply falls while demand remains high, shortages and higher prices may occur. Therefore, sustainable use of resources can help maintain a more stable market over time.
Question 4. Have you ever seen or heard of the government fixing prices or wages (for example, bus fares, medicines, or minimum wages)? Share an example and why you think it was done. (Page No. 206)
Answer: Yes. The government regulates the prices of certain essential medicines and sets minimum wages for workers. Such measures are intended to keep essential products affordable and ensure that workers receive a minimum level of income for their work.
Don’t Miss Out
Question 1. Did you notice that the market demand curve is flatter than Srivalli’s individual demand curve? (Page No. 198)
Answer: Yes. The market demand curve combines the demand of many consumers, so it reflects a broader response to changes in price. A given price change can therefore produce a larger change in total quantity demanded than it does for one individual consumer, making the market demand curve flatter.
Let’s Recall
Question 1. In the chapter ‘Democracy’, you have read that a democratic government is accountable to the people and is expected to act in their interest. (Page No. 208)
(a) According to you, how should a democratic government decide when and how much it should intervene in markets to protect people’s welfare?
Answer: A democratic government should intervene when market outcomes may harm public welfare, consumers, workers, or producers. The level of intervention should be carefully decided so that it addresses the problem without unnecessarily disturbing the efficient functioning of markets.
(b) Whose voices should a democratic government consider while making such decisions-consumers, producers, workers, or others? Why?
Answer: The government should consider the views of consumers, producers, workers, and other affected groups. Listening to different stakeholders helps policymakers understand the wider effects of a decision and create measures that are more balanced and socially beneficial.
Let’s Analyse
Question 1. Using data from the given table below, plot the demand and supply curves at the three prices, i.e., ₹ 40, ₹ 100, and ₹ 150. Identify and mark excess demand and supply on the graph. Think about how equilibrium could be reached in these scenarios. (Page No. 204)
Answer: At ₹40, buyers demand more than sellers are willing to supply, creating excess demand.
At ₹150, sellers offer more than buyers want to purchase, resulting in excess supply.
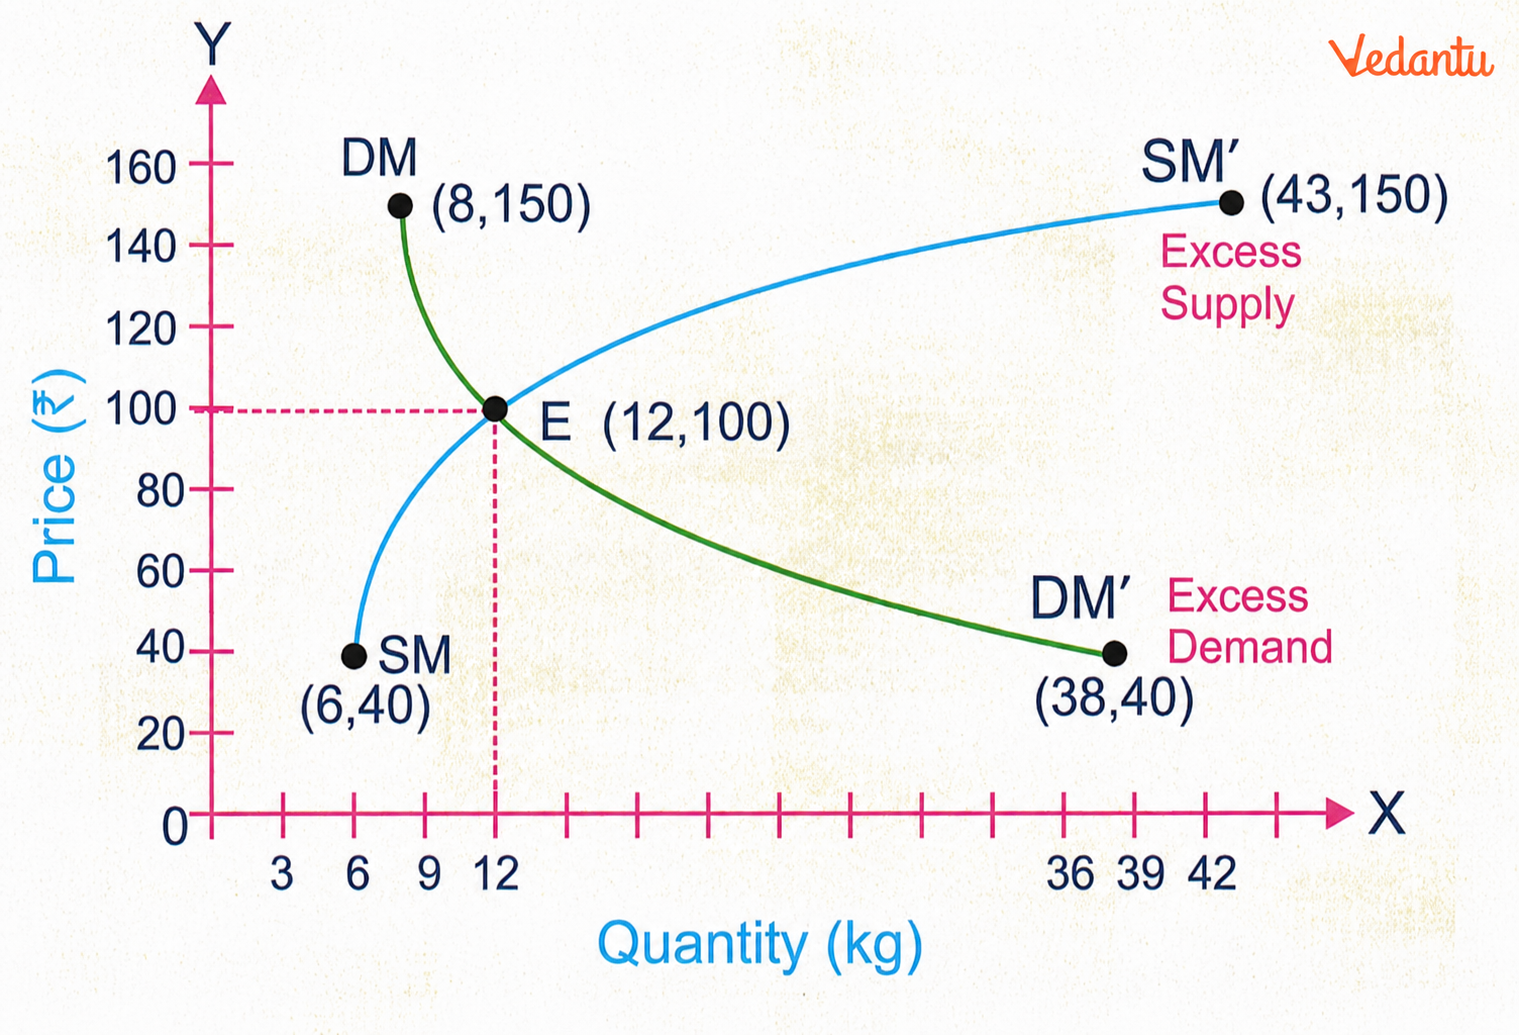
At ₹100, the quantity demanded equals the quantity supplied, so the market reaches equilibrium. In a free market, price adjustments can help move the market towards this balance.
Questions and Activities
Question 1. An increase in income always leads to a rise in demand for goods. Defend or refute, giving reasons for the same.
Answer: The statement is not always correct. Higher income can increase demand for many goods because people have greater purchasing power. However, demand also depends on preferences, prices, and the type of product. Therefore, an income increase does not necessarily raise demand for every good.
Question 2. If petrol prices double, what happens to
(a) Demand for diesel cars
(b) Demand for electric cars
(c) Demand for car accessories
(d) Demand for public transport
Answer:
(a) Demand for diesel cars may increase because some consumers may shift towards vehicles with lower running costs.
(b) Demand for electric cars is likely to rise because they can serve as an alternative to petrol-powered vehicles.
(c) Demand for accessories related to petrol cars may decline if fewer people purchase or use such vehicles.
(d) Demand for public transport may increase as people look for more affordable ways to travel.
Question 3. A farmer traditionally irrigates fields manually (labour-intensive). He installs drip irrigation (a technology upgrade) that reduces water use by 40% and increases yield by 30%. How does this affect
(a) His cost of production
(b) His willingness to supply at different prices
(c) The overall market supply if many farmers adopt this technology
Answer:
(a) His production costs are likely to fall because drip irrigation uses water more efficiently and can reduce resource wastage.
(b) With more efficient production and higher yields, the farmer may be willing to supply a larger quantity even at lower prices.
(c) If many farmers adopt the technology, total agricultural output can increase, causing the overall market supply to rise.
Question 4. During online festival sales, the prices of many products are very low. Use the concept of demand and supply to explain why the sellers sell at such a low price. What happens to the equilibrium when the price is lowered? Does this benefit only consumers or sellers as well? Explain.
Answer: During festival sales, sellers often lower prices to attract more customers and increase the number of products sold. A lower price generally increases quantity demanded. If the lower price creates excess demand, market forces can push the market towards a new equilibrium with a higher quantity traded. Consumers benefit from lower prices, while sellers can benefit from increased sales volume.
Question 5. Suppose the government sets a maximum sale price for an essential vaccine below the market- driven price. What is likely to happen? Choose from the options below and elucidate your point.
(a) Surplus
(b) Shortage
(c) No effect
(d) Fall in demand
Answer: (b) Shortage
When the government sets a maximum price below the market equilibrium price, the lower price encourages consumers to demand more while suppliers may offer less. As a result, quantity demanded becomes greater than quantity supplied, creating a shortage.
Question 6. The government levies higher taxes on products such as tobacco and alcohol to promote healthier choices among citizens. Can you find out other goods where price controls have been set in place? What are the reasons for the same?
Answer: Price controls or regulations may apply to essential medicines, fertilisers, and certain essential food products. Such measures can help keep important goods affordable, protect consumers from excessive prices, and support wider social welfare objectives.
Question 7. Can excessive government regulation hurt markets? Explain with suitable examples.
Answer: Yes. Excessive regulation can raise compliance costs, reduce incentives for producers, and sometimes discourage investment or innovation. For example, if price controls are set too strictly, producers may find it less attractive to increase production, which can affect the availability of goods in the market.
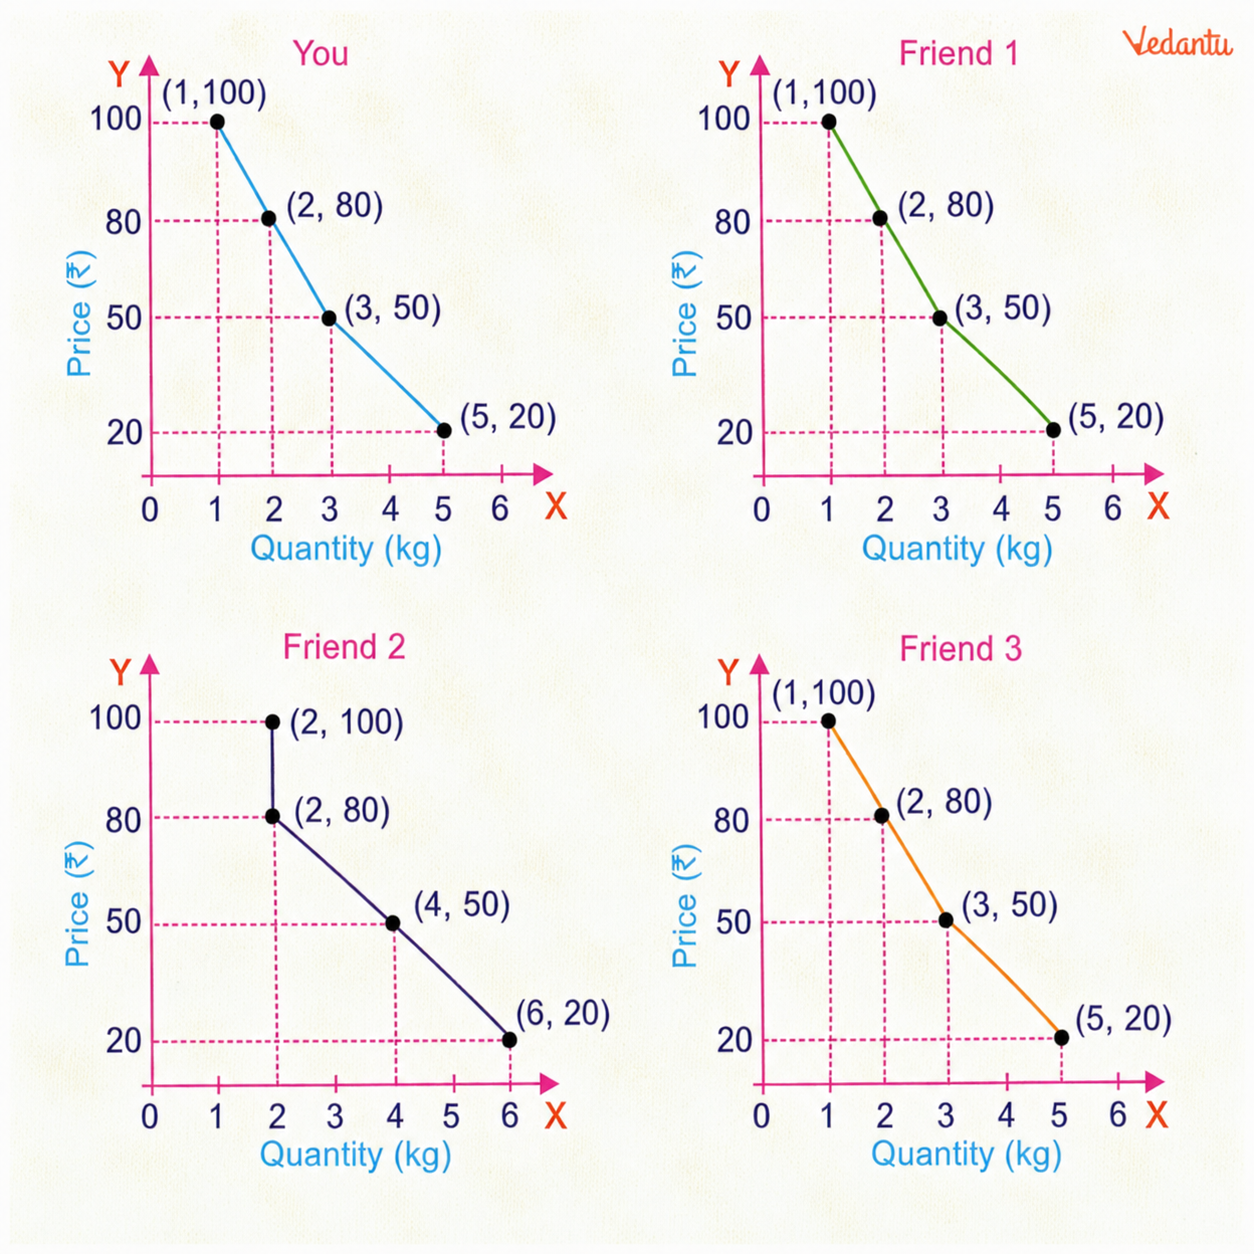
Question 8. In the table below, different prices of guava are given.
(a) Think and write how much guava you will buy at each price.
(b) Ask the same question to three of your friends and fill in the table.
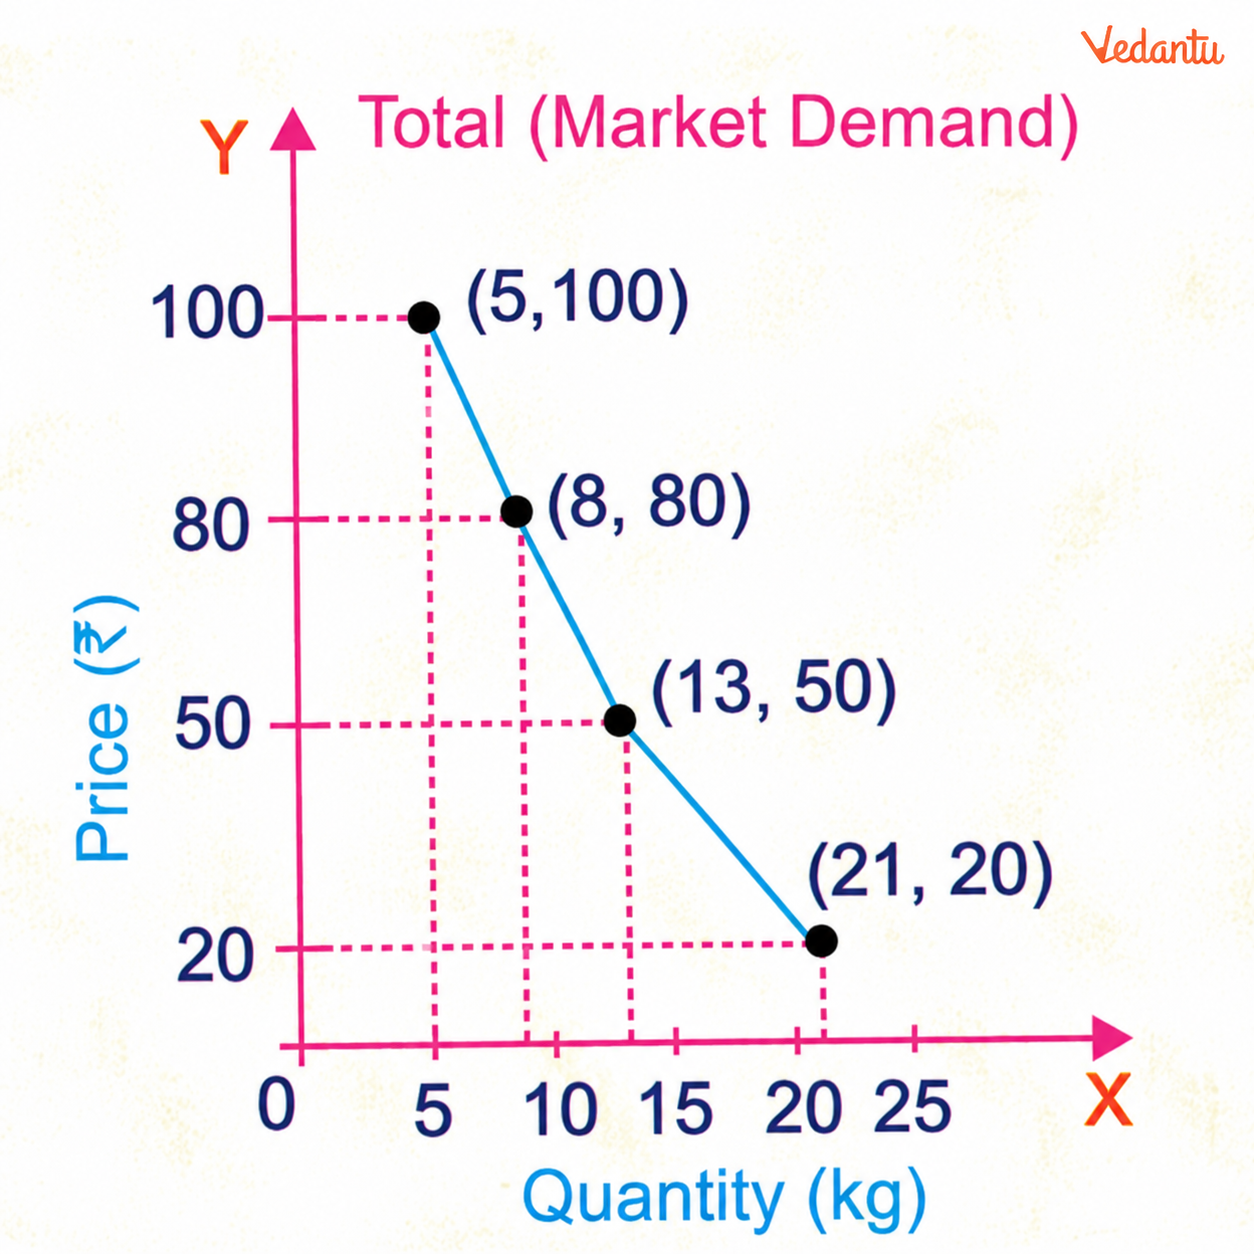
(c) Also make a graph for each one of you and one final graph for the total quantity.
Answer:
Observation: The table shows that quantity demanded rises as the price of guava falls.
Question 9. Visit the nearby vegetable market and try to find answers to the following questions.
(a) Who decides the prices of different vegetables in the vegetable market?
(b) Sometimes the prices of a few vegetables are too high, and sometimes too low. Why is this?
(c) The price of tomatoes is high in the morning and eventually gets lower by the evening. Have you ever noticed this? Comment.
Answer:
(a) Vegetable prices are mainly influenced by the interaction between buyers' demand and sellers' supply. Availability, competition, and market conditions also affect the final price.
(b) Prices may rise or fall depending on seasonal availability, weather conditions, production levels, transportation, and changes in demand.
(c) Yes. Sellers may reduce tomato prices towards the evening if they have unsold stock, as they may prefer selling it at a lower price rather than risk spoilage.
Question 10. Categorise the following combination of goods into substitute goods and complementary goods.
(a) Movie ticket in the cinema hall and popcorn
(b) Eraser and pencil
(c) Laptop and computer
(d) Air Conditioner and cooler
(e) Notebook and pen
(f) Apple and banana
(g) Mobile and earphones
Answer:
Question 11. The figure below shows the demand curve DD’ and supply curve SS’. Based on the figure, answer the following questions:
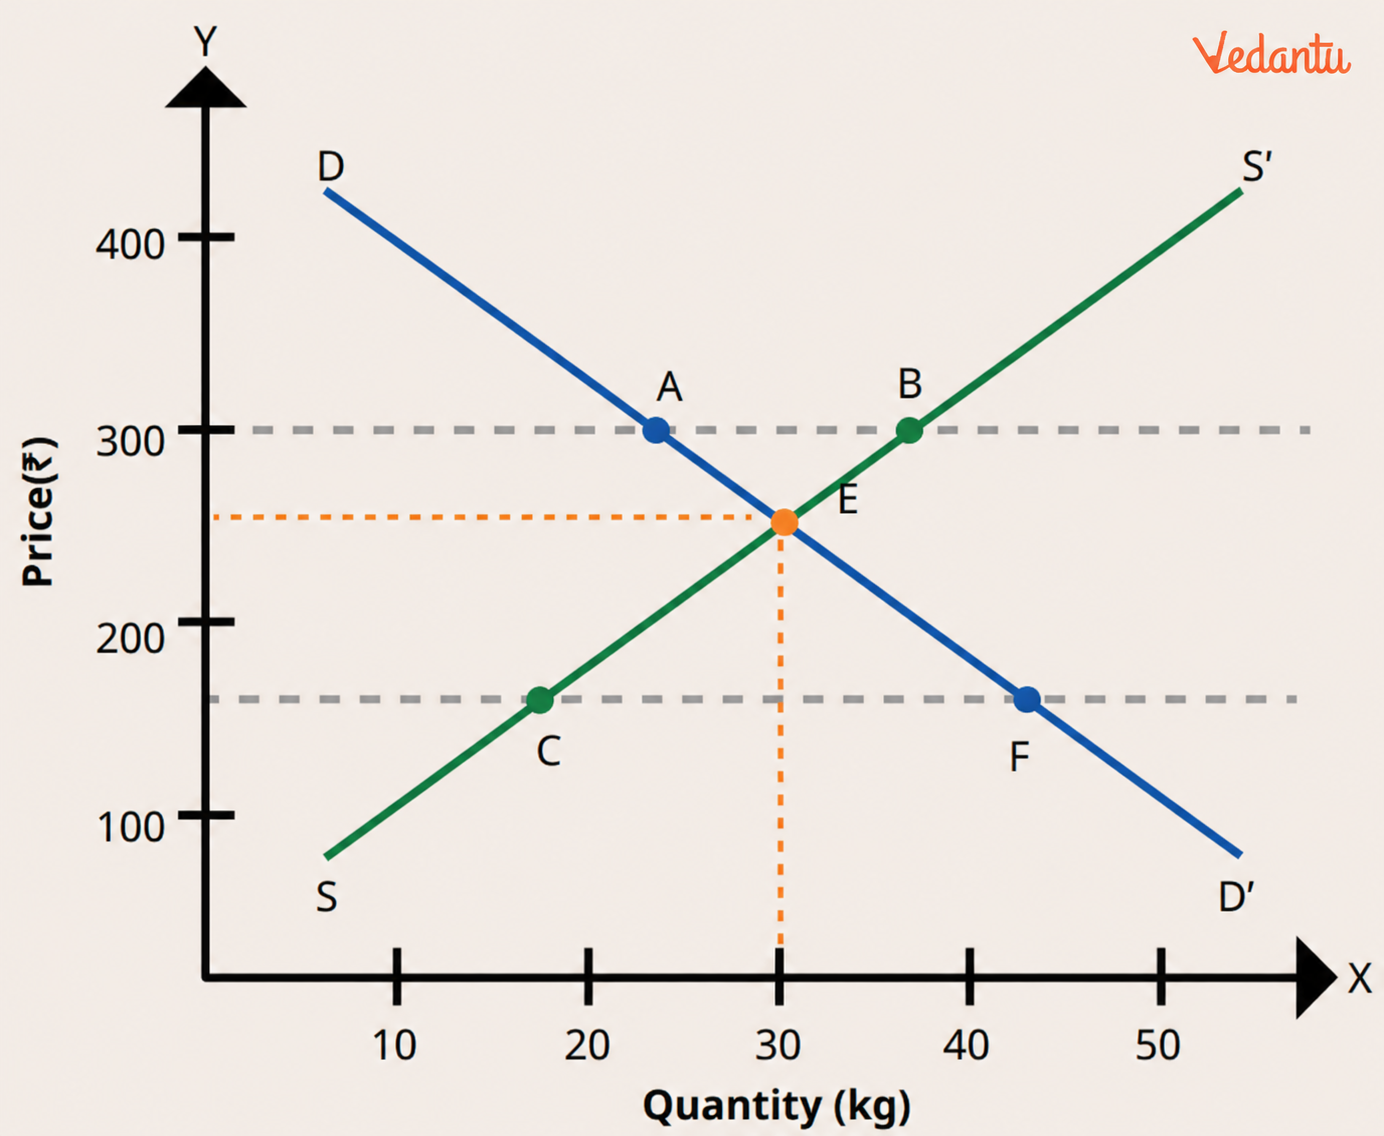
(a) What does point E represent in this market?
(b) What is the equilibrium price and equilibrium quantity at point E?
(c) Point A lies on DD. Point B lies on SS’. What do the points A and B indicate about demand and supply? What does the gap between A and B (both on the upper dashed price line) represent?
(d) Point F lies on DD’. Point C lies on SS’. What do the points F and C indicate about demand and supply? What does the gap between C and F (both on the lower dashed price line) represent?
(e) If the price stays at the lower dashed line, what could happen next in a free market?
Answer:
(a) Point E represents the market equilibrium, where quantity demanded and quantity supplied are equal.
(b) Equilibrium Price = ₹250
Equilibrium Quantity = 30 kg
(c) Point A represents the quantity demanded at the higher price, while point B represents the quantity supplied. The difference between them indicates excess supply or surplus.
(d) Point F represents the quantity demanded at the lower price, while point C represents the quantity supplied. Their difference shows excess demand or shortage.
(e) A shortage would create upward pressure on prices. As prices rise, demand may decrease while supply increases, gradually moving the market towards equilibrium.
Question 12. Draw a market equilibrium graph using the following demand schedule.
(a) Plot the demand and supply curves using the above data.
(b) Identify the equilibrium price and quantity.
(c) Observe the above data and analyse what happens if the price is set at ₹ 20 or ₹ 40.
Answer:
(a) Plot the given demand and supply values on the graph and join the corresponding points to obtain the two curves.
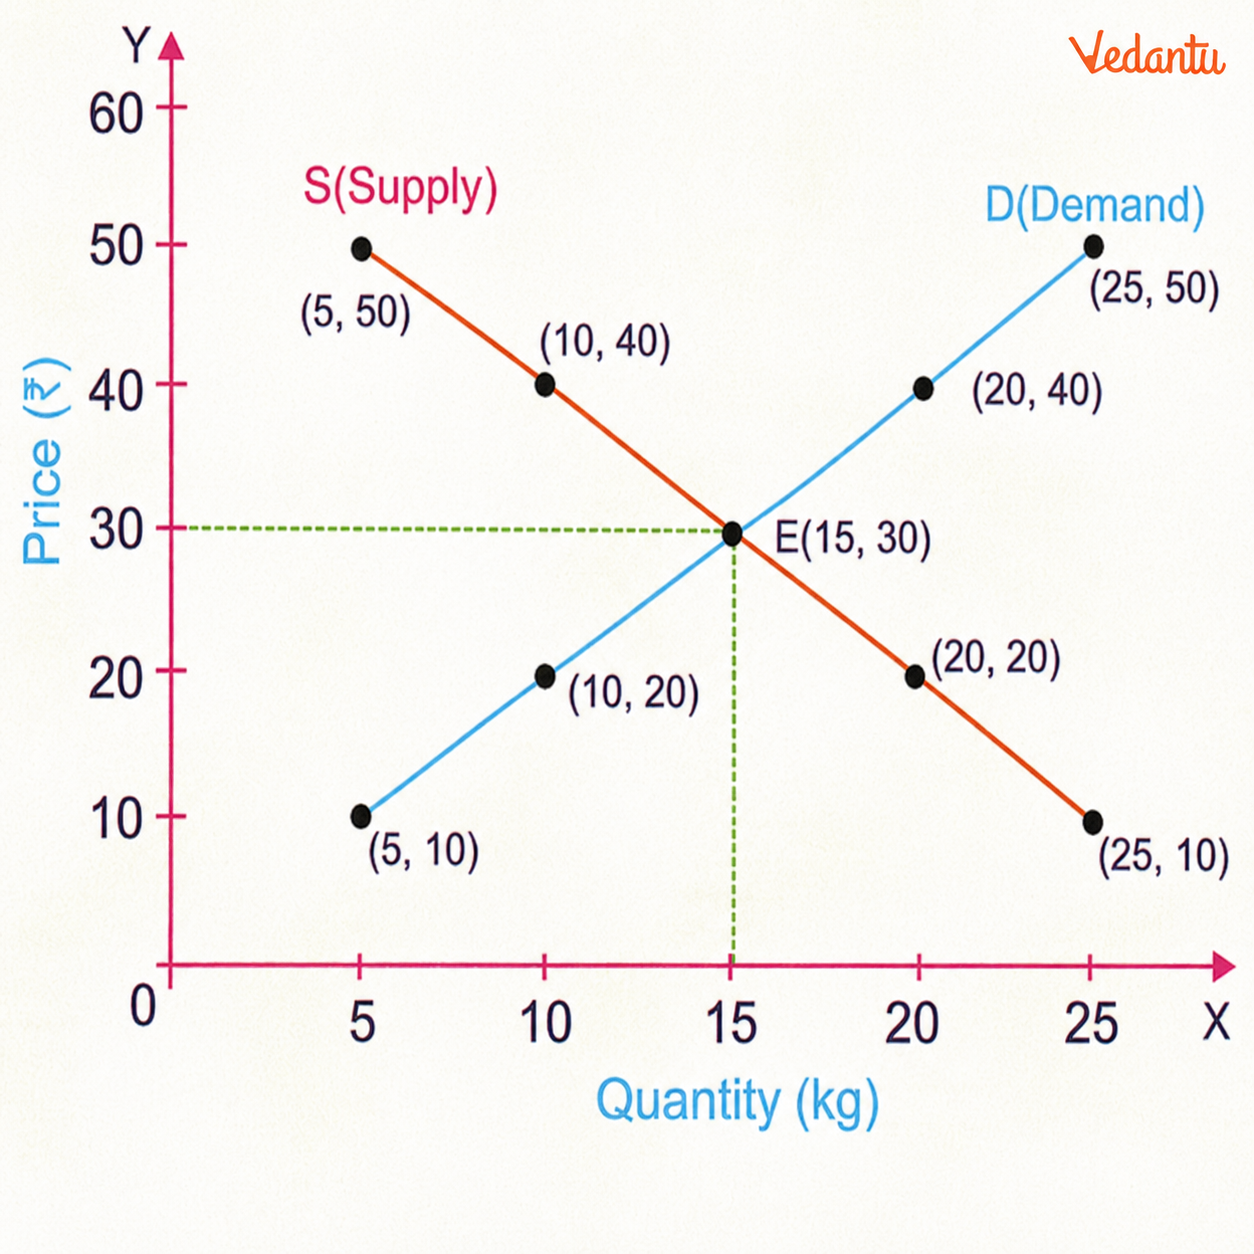
(b) Equilibrium Price = ₹30
Equilibrium Quantity = 15 kg
(c) At ₹20, the quantity supplied is greater than the quantity demanded, resulting in excess supply. At ₹40, quantity demanded exceeds quantity supplied, creating excess demand or shortage. Market forces would tend to adjust the price towards the equilibrium level of ₹30.
Key Takeaways from The Price Puzzle: What Drives the Market
Understand prices: Learn how demand and supply influence market prices.
Connect with daily life: Relate concepts to discounts, vegetables, fuel, and other familiar examples.
Strengthen concepts: Revise equilibrium, shortage, surplus, and government intervention.
Prepare effectively: Use Class 9 Social Science Chapter 9 solutions and the Class 9 Social Science Chapter 9 question-answer section for practice.
Quick revision: The Price Puzzle: What Drives the Market Class 9 PDF can help students review key concepts before assessments.
Related Study Materials for Class 9 Social Science Chapter 9: The Price Puzzle: What Drives the Market
Explore Class 9 Social Science Chapter-Wise NCERT Solutions (Understanding Society India and Beyond Part 1)
Related Study Material for Class 9 Social Science
FAQs on NCERT Solutions for Class 9 Social Science Chapter 9 The Price Puzzle: What Drives the Market 2026-27
1. If the price of a product suddenly increases, which Chapter 9 concept can help explain it?
The demand-supply relationship helps explain such changes. A fall in supply or a rise in demand can create excess demand, putting upward pressure on the price.
2. Can a student use the Class 9 Social Science Chapter 9 Question Answer PDF for revision?
Yes. A Class 9 Social Science Chapter 9 Question Answer PDF can be useful for revising textbook questions, checking answer formats, and quickly reviewing important market concepts before a test.
3. Suppose a shop has too many unsold products. What market situation does this indicate?
It indicates excess supply or surplus. Sellers may reduce the price to attract more buyers and clear their unsold stock.
4. Your friend says that a lower price always means higher demand. Would you agree?
Not necessarily. Price is an important factor, but income, preferences, availability of substitutes, and other conditions can also influence a consumer's demand.
5. Why might two similar products have different demand among students?
Students may have different preferences, budgets, perceptions of quality, or brand choices. These factors can cause their demand for similar products to vary.
6. What would happen to market supply if a new technology makes production cheaper?
Lower production costs can encourage producers to supply more goods. If many producers adopt the technology, the overall market supply may increase.
7. A vegetable seller lowers the price near closing time. Which idea from the chapter does this situation illustrate?
It can illustrate the effect of changing market conditions. If the seller has unsold vegetables that may spoil, reducing the price can help increase sales before the market closes.
8. Why should students practise both demand schedules and graphs for this chapter?
Schedules provide numerical information about buying and selling quantities, while graphs help students visualise their relationship. Practising both makes equilibrium, shortage, and surplus easier to understand.
9. Where would the idea of substitute goods appear in a student's daily life?
Choosing between two alternatives, such as travelling by bus or metro, can demonstrate substitution. If one option becomes more expensive or less convenient, students may prefer the other.
10. What could happen if an essential product is sold below its equilibrium price?
Demand may become greater than supply, resulting in a shortage. This is why the chapter discusses the possible effects of government price controls.
11. How does this chapter connect economics with situations students see around them?
Examples such as changing vegetable prices, online festival discounts, transport choices, fuel costs, and government-provided services show how economic decisions operate in everyday life.
12. Before using the Class 9 Social Science Chapter 9 solutions, what should a student do?
Students should first read the relevant textbook section and attempt the questions independently. The solutions can then be used to verify concepts, improve answer presentation, and identify gaps in understanding.
13. Which part of The Price Puzzle: What Drives the Market Class 9 PDF is especially useful before an exam?
The question-answer section, demand-supply examples, graph-based questions, and key concepts such as equilibrium, shortage, surplus, and government intervention are particularly useful for quick revision.