


Equation And Properties Of A Graph Parallel To The X Axis With Examples
In the coordinate plane, there is an infinity of points. A line traverses a point. Equations of horizontal and vertical lines and equations in point-slope, two-point, slope-intercept, intercept, and standard forms are examples of straight-line equations. In the following parts on this page, you can learn more about the equation of a line parallel to the x-axis and answer the question of which graph is parallel to the x-axis.
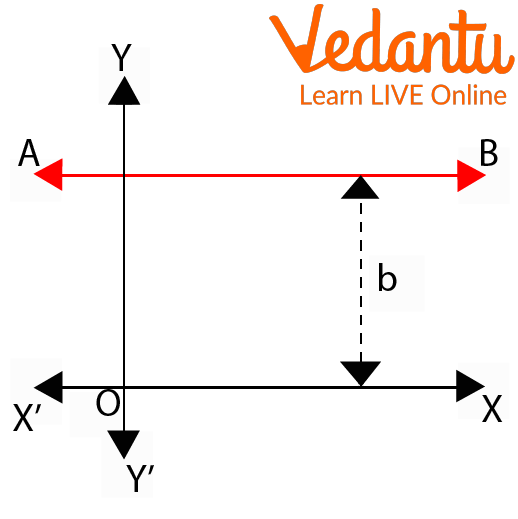
Line AB represents the Line Parallel to the x-axis
By the end of this article, we will be able to answer the equation of the x-axis, which graph is parallel to the x-axis, and which is parallel to the x-axis.
What is the Equation of the X-axis or Equation of Line Parallel to the X-axis?
Equations of the x-axis or equations representing the lines parallel to the x-axis are of the type y = a, where a is a constant value, and this line cuts the y-axis at the coordinates (0, a). If we represent this line on the graph, it will be perpendicular to the unit from the x-axis line.
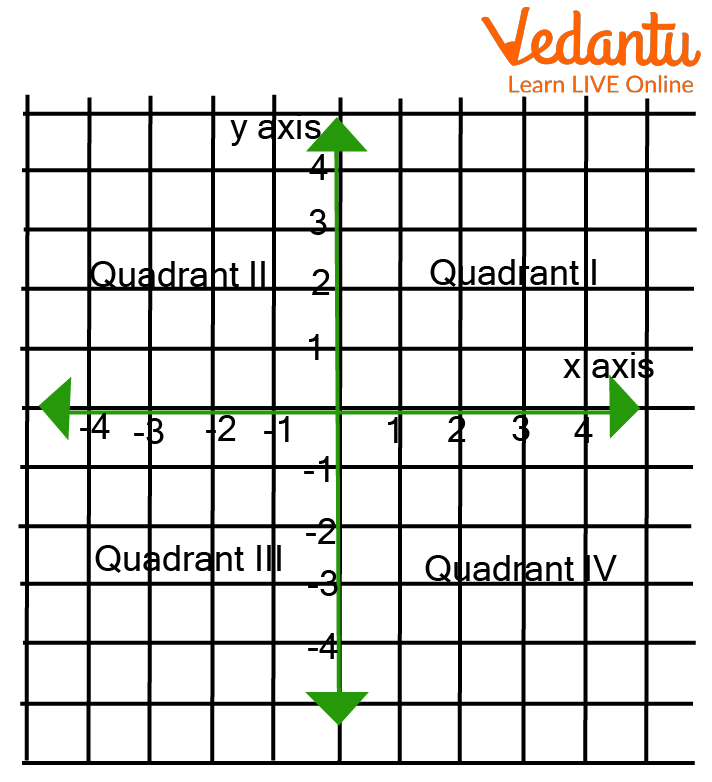
Cartesian Divided Into Four Quadrants
The equation of a line parallel to the x-axis in the positive y-axis always intersects through the 1st and the 2nd quadrant. At the same time, the equation of the line parallel to the x-axis in the negative y-axis intersects through the 3rd and the 4th quadrant of the coordinate axes.
Properties of the Equation of Line Parallel to the X-Axis
The following are the properties of the equation of the line parallel to the x-axis given:
The line parallel to the x-axis intersects the y-axis at one point.
Line parallel to x intersects y at only one point (0, a) and has the formula y = a.
The equation of line parallel to the x-axis and intersecting the y-axis at the point (0, a) is at an equidistance of 'a' units from the x-axis.
All points lying on the line parallel to the x-axis will have the same y coordinate
The slope of the line parallel to the x-axis will always be equal to zero.
Solved Examples
Example 1: Write the equations for the lines L1 and L3 out of the four equations as shown in the figure.
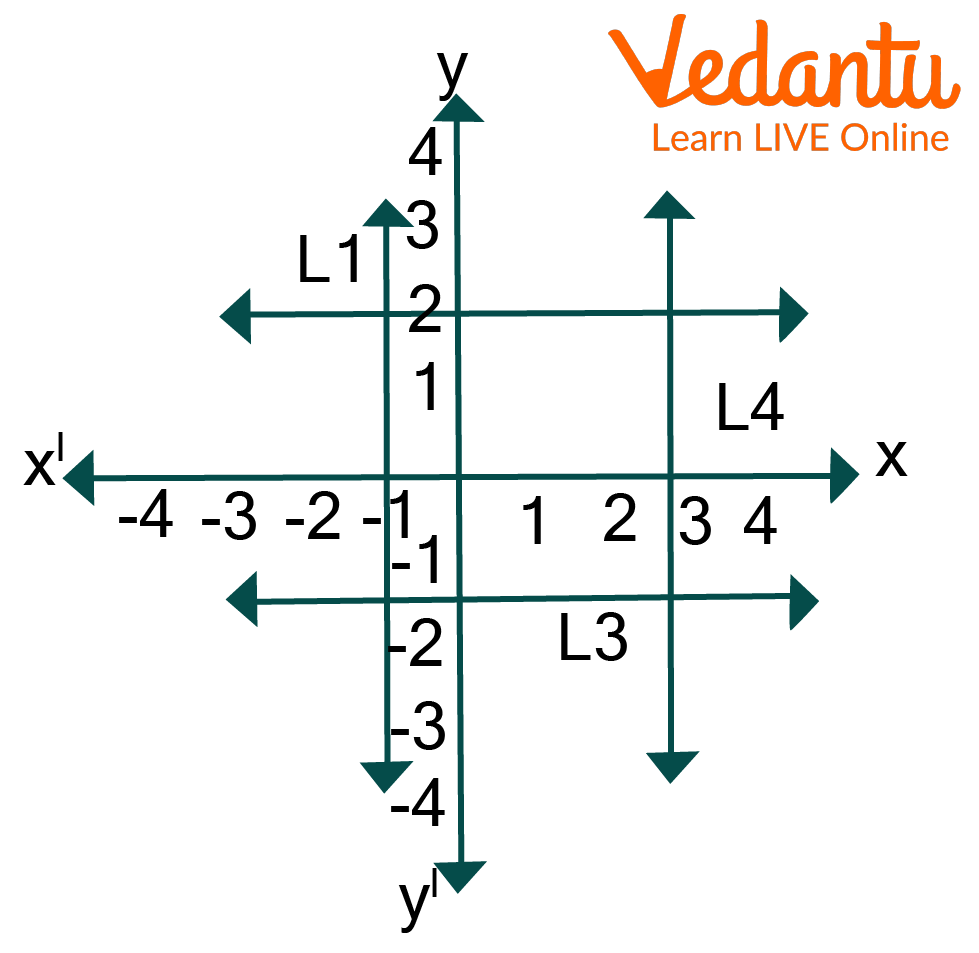
Graphical Representation
Ans: The equation of L1 according to the graph will be Y=2 and for L3 will be Y= -1.5 as the line is placed between -1 and -2
Example 2: Solve the equation of a line 7x – 12 = 16
Ans:
7x -12 = 16
7x = 16 + 12
x = $\dfrac{28}{7}$
x = 4
Example 3: Graphically represent the line of equation Y=5 and also tell the quadrants in which the line lies.
Ans: The line will be parallel to the x-axis and lies in the 1st and 2nd quadrants with all y coordinates with positive values.
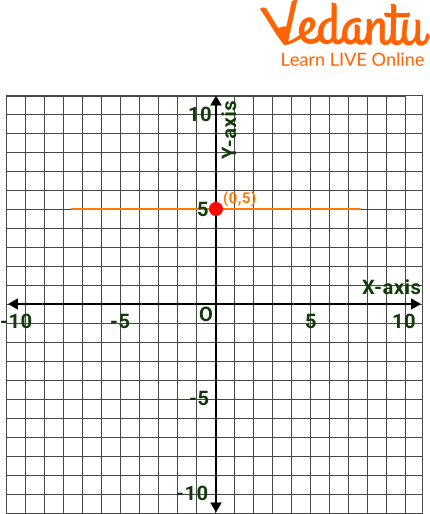
Line of Equation Y=5
Example 4: Which of the following is the equation representing a line parallel to the x-axis?
x=7, y= -2, x=2, y= 6
Ans: A line parallel to the x-axis should be placed on only y coordinates, and the slope of the line parallel to the x-axis is zero and is of the form y=a, which means that the above equations a and c do not satisfy any of the conditions as they will be placed at a point on the x-axis. At the same time, the other two equations represent the equation for a line parallel to the x-axis. Therefore, equation b Y=-2 will be placed at coordinate (0,-2), which will be a parallel line to the x-axis, and equation d Y=6 will also be placed at coordinate (0,6) parallel to the x-axis.
Practice Questions
Q 1: Which quadrant do y=-3 lie in?
Ans: The line will parallel the x-axis and lie in the 3rd and 4th quadrants.
Q 2: Which of the following equations is/are parallel to the x-axis?
6-3y=3
13x-6=20
12y+10=7×10
Ans: Equations 1 and 3 are the equations representing lines parallel to the x-axis.
Q 3: Find the equation for the line perpendicular to the x-axis and 7 units below the x-axis.
Ans: The line will be placed at (0,-7) and in the negative quadrant.
Summary
To conclude all the learnings from that article we can summarise that any line that is parallel to the x-axis on a graph always has the x coordinate as zero, whereas the y coordinate always has a value whether it be negative or positive. Moreover, in this article, we also saw various solved examples and practice questions. Lines parallel to the x-axis. Also, we saw how to solve and represent them over graphs. With this, we would like to end this article and hope that we were easy and clear to understand.
FAQs on Which Graph Is Parallel To The X Axis In Coordinate Geometry
1. Which graph is parallel to the x axis?
A graph is parallel to the x-axis when it represents a horizontal line with an equation of the form y = c, where c is a constant. This means:
- The value of y remains constant.
- The value of x can be any real number.
- The line never rises or falls as x changes.
For example, the graph of y = 4 is a straight horizontal line parallel to the x-axis passing through y = 4.
2. What is the equation of a line parallel to the x axis?
The equation of a line parallel to the x-axis is y = c, where c is a constant number. In this equation:
- y is fixed at one value.
- x can take any value.
Examples include y = 0, y = -3, and y = 7.5, all of which are horizontal lines parallel to the x-axis.
3. Why is y = 5 parallel to the x axis?
The line y = 5 is parallel to the x-axis because the value of y remains constant at 5 for all values of x. This means:
- The graph is a horizontal line.
- There is no vertical change as x increases.
- The slope of the line is 0.
Any equation of the form y = constant always produces a line parallel to the x-axis.
4. What is the slope of a line parallel to the x axis?
The slope of a line parallel to the x-axis is 0. Since the line is horizontal:
- There is no change in y (rise = 0).
- There can be any change in x (run ≠ 0).
- Slope = rise/run = 0.
Therefore, all horizontal lines have a slope of zero.
5. How do you graph a line parallel to the x axis?
To graph a line parallel to the x-axis, draw a horizontal line at the given y-value. Follow these steps:
- Identify the equation in the form y = c.
- Locate the value c on the y-axis.
- Draw a straight horizontal line across the graph.
For example, for y = -2, draw a horizontal line passing through -2 on the y-axis.
6. What is the difference between a line parallel to the x axis and a line parallel to the y axis?
A line parallel to the x-axis is horizontal with equation y = c, while a line parallel to the y-axis is vertical with equation x = c. The key differences are:
- Horizontal line: slope = 0, y is constant.
- Vertical line: slope is undefined, x is constant.
For example, y = 3 is horizontal, but x = 3 is vertical.
7. Does a horizontal line always mean it is parallel to the x axis?
Yes, every horizontal line is parallel to the x-axis. A horizontal line:
- Has the form y = c.
- Has a slope of 0.
- Never intersects the x-axis unless c = 0.
Therefore, all horizontal lines are parallel to the x-axis.
8. Can a function be parallel to the x axis?
Yes, a function can be parallel to the x-axis if it is a constant function of the form f(x) = c. In this case:
- The output value does not change.
- The graph is a horizontal line.
- The slope is 0.
For example, f(x) = 6 is a constant function parallel to the x-axis.
9. How do you know if a graph is parallel to the x axis?
A graph is parallel to the x-axis if it is a straight horizontal line with slope 0 and equation y = c. You can check by:
- Confirming that y stays the same for all x-values.
- Calculating the slope and verifying it equals 0.
- Observing that the line does not tilt upward or downward.
If these conditions are met, the graph is parallel to the x-axis.
10. What is an example of a graph parallel to the x axis?
An example of a graph parallel to the x-axis is y = 2. This means:
- Every point on the line has a y-coordinate of 2.
- The line is horizontal.
- The slope is 0.
Other examples include y = -4 and y = 10, which are all horizontal lines parallel to the x-axis.