


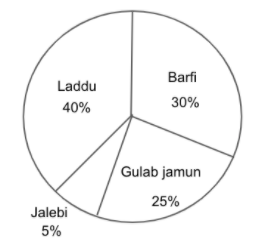
The following pie-chart represents different types of sweets sold in a shop on a particular day.
Read the pie-chart and answer the following questions:
(i) How many kilograms of barfi and gulab jamun are sold if 50 kg sweets are sold on the day?
(ii) Find the fraction of the circle representing each of the information.
Answer
232.8k+ views
Hint: Here, we will find the amount of the sweets by multiplying the given percentage by the amount sold on the day and then add them to find the net sold. Then we will find the fractions by simplifying the given percentage representing each of the information.
Complete step-by-step solution
(i) Now we will find the amount of barfi sold when 50 kg sweets are sold on the day.
\[
{\text{Barfi sold}} = 50 \times \dfrac{{30}}{{100}} \\
= 15{\text{ kg}} \\
\]
We also calculate the amount of gulab jamun sold when 50 kg sweets are sold on the day.
\[
{\text{Gulab Jamun sold}} = 50 \times \dfrac{{25}}{{100}} \\
= \dfrac{{125}}{{10}} \\
= 12.5{\text{ kg}} \\
\]
Adding the above amount of barfi and gulab jamun sold, we get
\[
{\text{Net sold}} = 15 + 12.5 \\
= 27.5{\text{ kg}} \\
\]
Thus, the net sold of barfi and gulab jamun is \[27.5\] kg.
(ii) Since it is given that the pie chart is formed from percentage, so the total number outcomes will be 100.
We will now find the fraction of percentage for laddu from the given pie chart.
\[
{\text{Fraction for Laddu}} = \dfrac{{40}}{{100}} \\
= \dfrac{2}{5} \\
\]
Finding the fraction of percentage for barfi from the given pie chart, we get
\[
{\text{Fraction for Barfi }} = \dfrac{{30}}{{100}} \\
= \dfrac{3}{{10}} \\
\]
Now we will calculate the fraction of percentage for gulab jamun from the given pie chart.
\[
{\text{Fraction for Gulab Jamun }} = \dfrac{{25}}{{100}} \\
= \dfrac{1}{4} \\
\]
We will now find the fraction of percentage for jalebi from the given pie chart.
\[
{\text{Fraction for Jalebi }} = \dfrac{5}{{100}} \\
= \dfrac{1}{{20}} \\
\]
Thus, the fraction for laddu is \[\dfrac{2}{5}\], fraction for barfi is \[\dfrac{3}{{10}}\], fraction for gulab jamun is \[\dfrac{1}{4}\] and fraction for jalebi is \[\dfrac{1}{{20}}\].
Note: In solving these types of questions, you should be familiar with the conversion of percentage to fractions. Then use the given conditions and values given in the question after examining the pie chart carefully, to find the values. Some students take the amount of one sweet as the required answer instead of adding there amounts to find the net sold.
Recently Updated Pages
Mutually Exclusive vs Independent Events: Key Differences Explained
Area vs Volume: Key Differences Explained for Students
Area of an Octagon Formula Explained Simply
Absolute Pressure Formula Explained: Key Equation & Examples
Central Angle of a Circle Formula Explained Quickly
Difference Between Vapor and Gas: JEE Main 2026
Trending doubts
JEE Main 2026: Session 2 Registration Open, City Intimation Slip, Exam Dates, Syllabus & Eligibility
JEE Main 2026 Jan 21 Shift 1 Question Papers with Solutions & Answer Keys – Detailed Day 1 Analysis
JEE Main Response Sheet 2026 Released – Key Dates and Official Updates by NTA
JEE Main 2026 Answer Key OUT – Download Session 1 PDF, Response Sheet & Challenge Link
JEE Main Marks vs Percentile 2026: Calculate Percentile and Rank Using Marks
JEE Main 2026 Jan 22 Shift 1 Today Paper Live Analysis With Detailed Solutions
Other Pages
Pregnancy Week and Due Date Calculator: Find How Far Along You Are
NCERT Solutions For Class 10 Maths Chapter 11 Areas Related to Circles (2025-26)
NCERT Solutions For Class 10 Maths Chapter 12 Surface Areas and Volumes (2025-26)
All Mensuration Formulas with Examples and Quick Revision
Complete List of Class 10 Maths Formulas (Chapterwise)
NCERT Solutions for Class 10 Maths Chapter 13 Statistics