

Explanation of the water cycle diagram with labeled stages
The water cycle diagram is a visual representation that explains how water circulates endlessly between the Earth's surface and atmosphere. Understanding this natural cycle helps students appreciate how water moves through different stages, supports life, and influences weather. This page covers the definition, key processes, and real-life significance of the water cycle, clearly explained for students of all levels.
What is a Water Cycle Diagram?
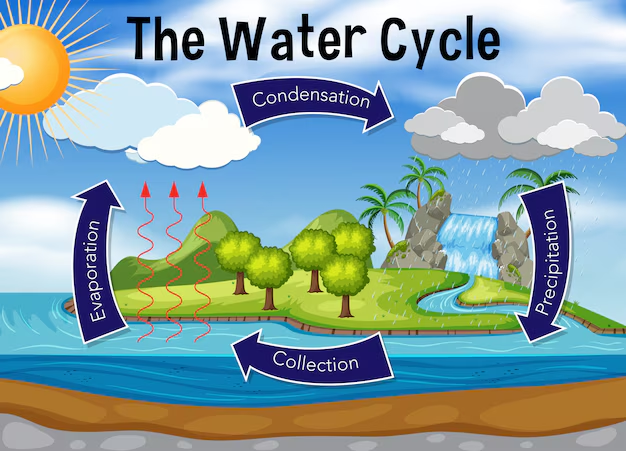
A water cycle diagram is a labeled illustration that shows the path water takes as it moves through the environment. It typically depicts processes like evaporation, condensation, precipitation, and runoff. This diagram is essential for understanding how water is stored, transferred, and replenished across Earth's systems. The water cycle diagram definition is widely used in school textbooks and environmental studies.
Main Processes in the Water Cycle
The water cycle consists of several interconnected stages that keep water moving through air, land, and living things. These processes occur simultaneously and maintain the balance of our planet's water resources.
- Evaporation: The sun heats up surface water from oceans, lakes, and rivers, turning it into water vapor that rises into the atmosphere.
- Transpiration: Plants lose water through small pores in their leaves, adding moisture to the air. Together with evaporation, this is called evapotranspiration.
- Condensation: As water vapor cools in the upper atmosphere, it changes back into tiny liquid droplets, forming clouds.
- Precipitation: When these droplets combine and grow larger, they fall back to Earth as rain, snow, sleet, or hail, depending on the temperature.
- Runoff and Collection: The water collects in rivers, lakes, and oceans, or soaks into the ground as groundwater. Some of it also flows back into oceans, completing the cycle.
Detailed Water Cycle Diagram Explanation
The water cycle diagram explanation highlights how each process is linked. For example, water vapor from evaporation and transpiration rises, cools, and then forms clouds through condensation. Eventually, gravity causes precipitation. Some water is absorbed by soil, refilling groundwater supplies. The rest runs off into streams and back to oceans or lakes, allowing the cycle to repeat. This cycle drives weather patterns, plant growth, and even influences climate (learn more on effects of climate changes).
Water Cycle Diagram Examples and Applications
Water cycle diagram examples appear in environmental science, agriculture, and even medicine. Farmers rely on the cycle to predict rainfall and manage irrigation. Scientists use the water cycle diagram class 12 to model water pollution and climate trends, which influence public health and urban planning. For instance, understanding runoff and groundwater movement is crucial in rainwater harvesting methods and controlling diseases that thrive in moist environments.
- Showing how water is replenished in drought-prone areas
- Explaining how pollutants travel through water sources
- Demonstrating the effect of deforestation on local climates
Human Impact on the Water Cycle
Human activities can change the water cycle, affecting its balance and health. For example, pollution, deforestation, and urban development alter how water is absorbed, flows, or evaporates. The release of chemicals and waste contaminates water, while excessive groundwater extraction can lower water tables. Water pollution and its control is a vital part of environmental science studies.
- Urbanization increases runoff, causing floods.
- Pesticides and fertilizers enter groundwater, affecting food quality (see food science).
- Climate change leads to unpredictable patterns of precipitation and droughts.
Residence Time in Water Cycle Reservoirs
The water cycle diagram includes various storage places or reservoirs, such as oceans, ice caps, lakes, rivers, and the atmosphere. The time water spends in each reservoir is called residence time. Oceans have long residence times (thousands of years), while atmosphere residence time is just about ten days before precipitation occurs. This concept is vital for understanding long-term changes and helps in managing resources for agriculture and human health. For more, visit life science.
Water Cycle Diagram Questions and Practice
Testing your understanding of the water cycle diagram is important. Students at all levels may find water cycle diagram MCQs, diagram labeling exercises, or scenario-based questions on their exams, especially in class 12. Practicing diagram-based questions will help you connect theoretical knowledge to real-world problems, like managing water in cities or farms. For more diagram practice, refer to important diagrams for CBSE and environmental issues.
Summary of Water Cycle Diagram
The water cycle diagram is a fundamental science tool that illustrates how water circulates naturally around our planet. It covers key processes such as evaporation, condensation, and precipitation, while also considering human and environmental impacts. By mastering this concept, students can better appreciate the importance of water in sustaining life and managing Earth's resources responsibly.


FAQs on Water Cycle Diagram and Process in Nature
1. What is the water cycle?
The water cycle is the continuous movement of water between the Earth's surface and the atmosphere through processes like evaporation, condensation, and precipitation. It describes how water circulates in different forms—liquid, solid, and gas—without being lost.
- Water evaporates from oceans, rivers, and lakes.
- Water vapor condenses to form clouds.
- Water returns to Earth as precipitation.
- It collects again in water bodies, completing the cycle.
2. What are the main steps in the water cycle diagram?
The main steps in a water cycle diagram are evaporation, condensation, precipitation, and collection. These stages show how water moves through the environment.
- Evaporation – Liquid water changes into water vapor due to heat from the Sun.
- Condensation – Water vapor cools and forms clouds.
- Precipitation – Water falls as rain, snow, sleet, or hail.
- Collection – Water gathers in oceans, lakes, rivers, and groundwater.
3. How does evaporation occur in the water cycle?
Evaporation occurs when liquid water absorbs heat energy from the Sun and changes into water vapor. This process mainly happens in oceans, lakes, and rivers.
- Solar energy increases the kinetic energy of water molecules.
- Faster-moving molecules escape into the atmosphere as gas.
- This forms invisible water vapor in the air.
4. What is condensation in the water cycle?
Condensation is the process by which water vapor cools and changes back into liquid water droplets. It occurs when warm air rises and loses heat in the atmosphere.
- Water vapor cools at higher altitudes.
- It forms tiny droplets around dust particles.
- These droplets gather to form clouds.
5. What is precipitation in the water cycle?
Precipitation is the process by which water falls from clouds to the Earth's surface in liquid or solid form. It occurs when water droplets in clouds become heavy enough to fall due to gravity.
- Forms include rain, snow, sleet, and hail.
- It replenishes freshwater sources.
- It supports ecosystems and living organisms.
6. What is transpiration in the water cycle diagram?
Transpiration is the release of water vapor from plant leaves into the atmosphere. It is a biological process that connects plants to the water cycle.
- Water is absorbed by roots from the soil.
- It travels through the plant to the leaves.
- It exits through tiny openings called stomata.
7. What is runoff in the water cycle?
Runoff is the flow of water over the Earth's surface after precipitation. It occurs when the soil cannot absorb all the falling water.
- Water flows into streams and rivers.
- It eventually reaches oceans, lakes, or reservoirs.
- It can cause erosion and shape landscapes.
8. Why is the water cycle important for living organisms?
The water cycle is important because it continuously recycles and distributes freshwater necessary for life. All living organisms depend on water for survival.
- Provides water for drinking and cellular processes.
- Maintains soil moisture for plant growth.
- Regulates climate and temperature.
- Supports aquatic and terrestrial ecosystems.
9. What is the difference between evaporation and transpiration?
The main difference between evaporation and transpiration is that evaporation occurs from water surfaces, while transpiration occurs from plants. Both processes release water vapor into the atmosphere.
- Evaporation – Physical process from oceans, lakes, and soil.
- Transpiration – Biological process through plant stomata.
- Together they form evapotranspiration.
10. How do you label a water cycle diagram?
A water cycle diagram is labeled by identifying the main processes and water storage areas. Clear labeling helps understand how water moves through the cycle.
- Evaporation from oceans or lakes.
- Condensation forming clouds.
- Precipitation falling to Earth.
- Runoff flowing into rivers.
- Transpiration from plants.
- Collection in oceans and groundwater.


