

What Is a Population Pyramid Definition Types and Interpretation
The population pyramid is a powerful graphical tool in biology and demography. It visually represents the age and gender distribution of a population at a specific point in time. Understanding population pyramids helps scientists, policymakers, and even UPSC aspirants assess population trends, predict social needs, and plan for the future effectively.
What is a Population Pyramid?
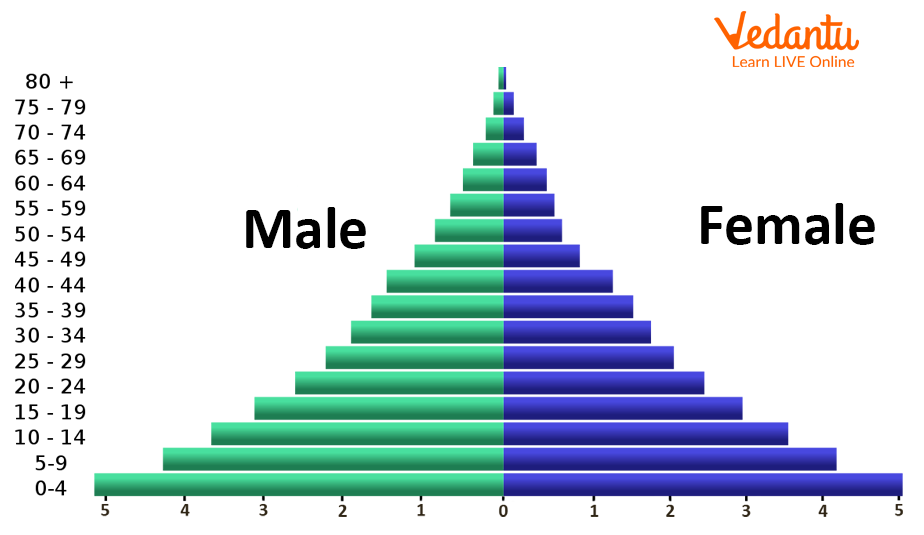
A population pyramid is a bar graph that displays the structure of a country’s population by age groups and sex. The left side shows males, while the right side shows females. Each horizontal bar represents a particular age group, with the length reflecting the population size of that group. Population pyramids are essential in studying demography, societal ageing, and understanding workforce trends.
Structure and Features of a Population Pyramid
A population pyramid typically consists of two mirrored vertical bars—one for each sex. The vertical axis denotes age groups, usually split into five-year intervals. The horizontal axis shows the population percentage or actual numbers. The shape of the pyramid reveals the population's growth rate and highlights phenomena such as birth rates, death rates, and life expectancy.
- Broad base: Indicates high birth rates.
- Narrow top: Indicates lower life expectancy.
- Bulges or indentations: Show unique events (wars, baby booms).
- Sex ratio: Gender distribution for each age group.
For more insights into population and demographics, explore the Malthusian theory of population growth on Vedantu.
Types of Population Pyramid
Population pyramids are generally classified into three major types based on their shapes, each reflecting a different demographic scenario. Understanding these types is important for comprehending the population dynamics of various countries.
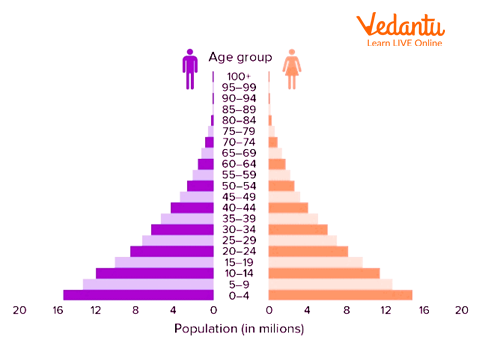
1. Expansive (Expanding) Population Pyramid
Expansive population pyramids have a broad base and narrow top, indicating a large proportion of young people and high birth rates. These are typical of developing countries with rapid population growth, such as parts of Africa and South Asia. The pyramid quickly tapers upwards, showing fewer older individuals due to higher mortality rates.
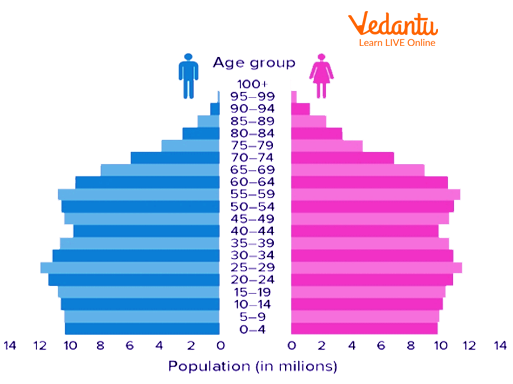
2. Stable (Stationary) Population Pyramid
The stable population pyramid, also known as a stationary pyramid, has nearly equal numbers in most age groups, giving it a bell or rectangular shape. Birth and death rates are low, typical of developed countries like the USA. This shape suggests stable population growth and balanced sex ratios across age groups.
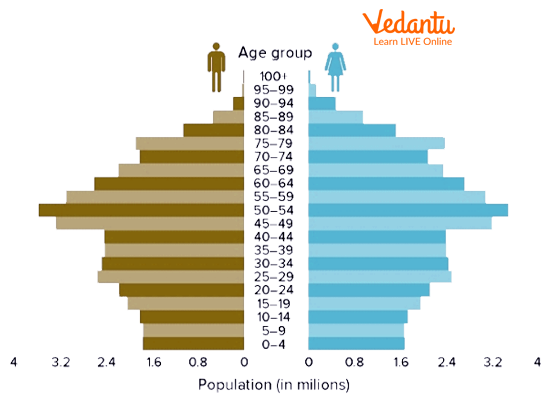
3. Constrictive (Declining) Population Pyramid
A constrictive or declining population pyramid has a narrower base than the middle, indicating low birth rates and an ageing population. Seen in countries like Japan and some European nations, it reflects longer life expectancy and challenges such as shrinking workforce and higher dependency ratios.
Population Pyramid of India: Trends and Analysis
The population pyramid of India is an excellent example of the expansive type, though it is gradually trending toward a more stable shape. Young people make up a large proportion, with slow but visible increases in the elderly sections due to improved healthcare and rising life expectancy. The India population pyramid 2024 and projections for 2025 show this demographic transition.
- India’s base is wider—high percentage of youth and working-age groups.
- Gradual narrowing at the top reveals a growing, but still small, elderly population.
- Sex ratio at birth is slightly skewed, which policymakers observe closely.
Understanding the causes and effects of overpopulation is crucial for grasping India’s challenges and planning for the future.
Significance and Applications of Population Pyramids
Population pyramids are more than just diagrams—they provide deep insights into a country's social, economic, and health needs. Governments, the United Nations, and researchers use them for:
- Forecasting future demands in education, jobs, and healthcare.
- Planning pension and social security systems as populations age.
- Understanding patterns in fertility and mortality rates.
- Identifying issues like a declining or rapidly growing population.
- Allocating resources in sectors such as agriculture or environmental management.
For more on how climate and the environment impact population structures, read about the effects of climate changes.
Population Pyramid and Sex Ratio
The sex ratio in a population pyramid shows the balance between males and females in each age group. Balanced or imbalanced sex ratios help predict social trends, identify possible future labor shortages, and aid in policy creation. In India, efforts to balance the sex ratio at birth and improve women’s literacy are closely related to achieving sustainable population stability.
How Population Pyramids Explain Demography
Demography is the scientific study of populations. Population pyramids explain the stages of population growth—expanding, stationary, and contracting. By interpreting a country's pyramid, you can:
- See if the population is growing, stable, or shrinking.
- Understand the potential for population momentum due to youth numbers.
- Assess the burden of dependents (young and old) on the working-age population.
- Plan for future needs, from education to elderly care.
If you’re eager to learn the difference between acquired and inherited traits, population pyramids can also reveal how such traits might spread in a population over time.
Comparison: Population Pyramids of India, Japan, and the USA
| Country | Pyramid Type | Key Features |
|---|---|---|
| India (2024/2025) | Expansive | Broad base, many young people, gradually increasing elderly population, high population growth |
| Japan | Constrictive | Narrow base, large elderly population, low birth rates, shrinking workforce |
| USA | Stable/Stationary | Even distribution across age groups, moderate elderly percentage, low but stable growth |
This table highlights how different countries are at different demographic stages, influencing their economic and social policies.
Conclusion and Real-World Implications
Population pyramids are central to planning in healthcare, education, environment, and economic development. They influence policies in medicine, agriculture, and even disaster management. Whether studying the India population pyramid for 2024 or forecasting for countries like Japan or Kenya, these diagrams powerfully explain a nation’s story in numbers—and help shape a sustainable, equitable future.
Want to widen your biology knowledge? Browse more expertly written resources at Vedantu, from life science to food science and beyond.
In summary, the population pyramid is an essential demographic tool. Its ability to display trends, compare different regions (like the population pyramid of India, Japan, or the USA), and guide vital policies makes it invaluable for students, researchers, and policymakers alike.


FAQs on Population Pyramid in Demography and Biology
1. What is a population pyramid?
A population pyramid is a graphical representation that shows the age and sex distribution of a population at a specific time. It is usually displayed as a bar graph with males on one side and females on the other.
- The horizontal axis represents population size or percentage.
- The vertical axis represents age groups (e.g., 0–4, 5–9, 10–14).
- It helps in understanding population growth trends and demographic structure.
2. What are the main types of population pyramids?
The three main types of population pyramids are expansive, stationary, and constrictive.
- Expansive pyramid: Broad base, high birth rate, rapid population growth.
- Stationary pyramid: Nearly equal age groups, stable population.
- Constrictive pyramid: Narrow base, low birth rate, aging population.
3. Why is a population pyramid important?
A population pyramid is important because it helps analyze population structure and predict future demographic trends.
- Shows birth and death rates.
- Indicates life expectancy and aging trends.
- Helps governments plan for education, healthcare, and employment.
4. How do you read a population pyramid?
A population pyramid is read by comparing the width of bars across age groups and between sexes.
- The left side usually represents males, and the right side represents females.
- Wider bars indicate a larger population in that age group.
- The shape reveals whether the population is growing, stable, or declining.
5. What does a broad base in a population pyramid indicate?
A broad base in a population pyramid indicates a high birth rate and a large proportion of young individuals.
- Common in developing countries.
- Suggests rapid population growth.
- May lead to increased demand for schools and jobs in the future.
6. What does a narrow base in a population pyramid mean?
A narrow base in a population pyramid means low birth rates and fewer young people in the population.
- Common in developed countries.
- Indicates slow or negative population growth.
- Often associated with an aging population.
7. How does a population pyramid show an aging population?
A population pyramid shows an aging population when the upper age groups are wider than the younger age groups.
- Higher proportion of people aged 60 years and above.
- Increased life expectancy.
- Low birth rate over time.
8. What is the difference between expansive and constrictive population pyramids?
The main difference between expansive and constrictive population pyramids is their birth rate and growth pattern.
- Expansive: Wide base, high birth rate, rapid growth.
- Constrictive: Narrow base, low birth rate, declining or aging population.
9. What factors affect the shape of a population pyramid?
The shape of a population pyramid is affected by birth rate, death rate, and life expectancy.
- High birth rates widen the base.
- High death rates reduce older age groups.
- Improved healthcare increases life expectancy.
- Migration can change age and sex distribution.
10. Can you give an example of a country with each type of population pyramid?
Different countries show different types of population pyramids based on their demographic stage.
- Expansive: Nigeria (high birth rate, rapid growth).
- Stationary: France (stable growth, balanced age groups).
- Constrictive: Japan (low birth rate, aging population).


