

Phases of Bacterial Population Growth Curve and Factors Affecting Growth
Bacteria are single-celled organisms that mainly reproduce by dividing into two cells, a process known as binary fission. Rather than getting bigger in size, their growth curve tracks how the number of cells increases over time. In suitable conditions, bacterial cells can divide rapidly, leading to a quick rise in their population.
A key measure here is the generation time, which is the time it takes for a bacterial cell to double in number. Different bacteria have different generation times depending on species and growing conditions:
Clostridium perfringens can double in about 10 minutes.
Escherichia coli often doubles in about 20 minutes.
Mycobacterium tuberculosis can take 12–16 hours to double.
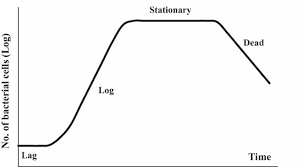
When bacteria are grown in a closed environment with limited nutrients, their population typically goes through four phases of the bacterial growth curve: lag, log (exponential), stationary, and death.
Phases of the Bacterial Growth Curve
1. Lag Phase
After being placed into a fresh nutrient medium, bacterial cells do not immediately start dividing.
They adapt to their new surroundings, synthesising the molecules (like proteins, RNA, and enzymes) needed for cell division.
Although cell numbers do not increase significantly, the cells become metabolically active and grow in size.
2. Log (Exponential) Phase
Once fully prepared, bacteria begin to divide at a constant rate, causing their numbers to multiply in a logarithmic manner (1 → 2 → 4 → 8 → 16, and so on).
This is called the exponential or log phase.
Cells are at their healthiest, and many experiments use bacteria from this phase.
The log phase lasts until nutrients start to become limited or harmful by-products build up.
3. Stationary Phase
As resources dwindle, growth slows down.
Eventually, the rate of new cell formation equals the rate of cell death.
The overall population remains constant, forming a flat (stationary) plateau on the graph.
4. Death Phase
When nutrients become scarce or toxic substances accumulate, more cells die than are formed.
The number of viable cells falls, leading to the death phase.
Generation Time Variations
Generation time depends on factors such as temperature, pH, nutrient availability, and oxygen levels.
Fast growers like Clostridium perfringens thrive in conditions that favour quick metabolism.
Slower bacteria, like Mycobacterium tuberculosis, have thicker cell walls and more complex requirements.
Quick Quiz
1. Which phase involves no increase in cell number but cells increase in size?
Answer: Lag phase.
2. In which phase do bacteria divide at a constant rate?
Answer: Log (exponential) phase.
3. Name any factor that can influence the generation time of bacteria.
Answer: Temperature, pH, nutrient availability, oxygen level, etc.
Related Topic Links


FAQs on Growth of Bacterial Populations and Their Growth Curve
1. What is the growth of bacterial populations?
The growth of bacterial populations refers to the increase in the number of bacterial cells through repeated cell division. Bacteria reproduce mainly by binary fission, where one cell divides into two identical daughter cells.
- Under ideal conditions, populations grow rapidly.
- Growth is measured as an increase in cell number, not cell size.
- It is commonly studied in controlled laboratory cultures.
2. How do bacteria reproduce and increase in number?
Bacteria increase in number primarily through binary fission, an asexual reproduction process. During this process:
- The bacterial DNA replicates.
- The cell elongates and separates the DNA copies.
- A septum forms, dividing the cell into two identical daughter cells.
3. What are the phases of the bacterial growth curve?
The bacterial growth curve consists of four main phases in a closed culture system. These phases are:
- Lag phase – Cells adapt to the environment but do not divide rapidly.
- Log (exponential) phase – Rapid cell division and maximum growth rate occur.
- Stationary phase – Growth rate equals death rate due to limited nutrients.
- Death (decline) phase – Cells die faster than new cells are formed.
4. What is the lag phase in bacterial growth?
The lag phase is the initial stage of bacterial growth where cells adapt to new environmental conditions before dividing. During this phase:
- Bacteria synthesize enzymes and essential molecules.
- There is little to no increase in cell number.
- Cells prepare for active division in the log phase.
5. What happens during the log phase of bacterial growth?
During the log (exponential) phase, bacteria divide at their maximum rate, causing rapid population increase. In this phase:
- Cells are metabolically most active.
- The population doubles at regular intervals called the generation time.
- Bacteria are most sensitive to antibiotics.
6. What is generation time in bacterial populations?
The generation time is the time required for a bacterial population to double in number. It depends on factors such as:
- Species of bacteria (e.g., Escherichia coli can divide in about 20 minutes under ideal conditions).
- Availability of nutrients.
- Temperature and environmental conditions.
7. What factors affect the growth of bacterial populations?
The growth of bacterial populations is affected by environmental and nutritional factors. Key factors include:
- Temperature – Each species has an optimum temperature.
- pH – Most bacteria prefer near-neutral pH.
- Nutrient availability – Carbon, nitrogen, and minerals are essential.
- Oxygen levels – Aerobic or anaerobic requirements vary.
- Moisture – Water is necessary for metabolic activities.
8. Why does the bacterial population reach a stationary phase?
The stationary phase occurs when the rate of bacterial cell division equals the rate of cell death due to limited resources. This happens because:
- Nutrients become depleted.
- Waste products accumulate.
- Space becomes limited in the culture.
9. What is the difference between exponential growth and logistic growth in bacteria?
The main difference between exponential growth and logistic growth is resource limitation.
- Exponential growth occurs when resources are unlimited, and the population increases rapidly without restriction.
- Logistic growth occurs when resources are limited, causing growth to slow and stabilize at the carrying capacity.
10. How is bacterial population growth measured in the laboratory?
Bacterial population growth is measured using direct and indirect laboratory methods. Common methods include:
- Plate count method – Counts colony-forming units (CFUs).
- Turbidity measurement – Uses a spectrophotometer to measure optical density.
- Direct microscopic count – Counts cells under a microscope.


