

What Are the Types of Ecological Pyramids with Definition Structure and Diagram
An ecological pyramid is a graphical representation that illustrates how different groups of organisms (producers, consumers, and decomposers) are structured and how energy or biomass flows across various trophic levels in an ecosystem.
The idea of representing these relationships in a pyramid shape dates back to the work of Charles Elton, who first introduced the concept of the pyramid of numbers. Later, scientists such as G. Evelyn Hutchinson and Raymond Lindeman contributed valuable insights into the flow of energy, leading to the development of the pyramid of energy.
Also Read: Ecology
Types of Ecological Pyramid
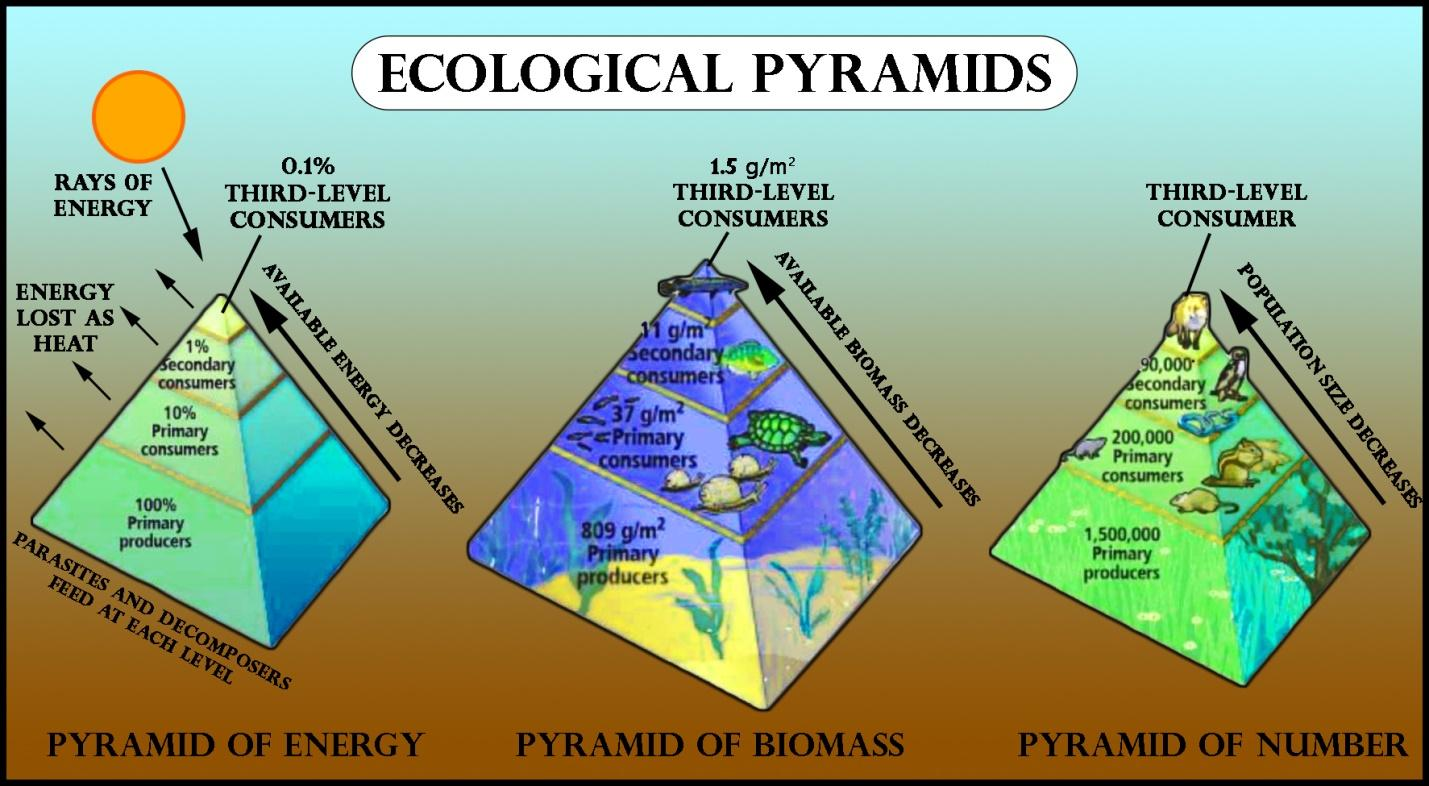
There are three major types of ecological pyramids commonly studied in biology:
Pyramid of Number
Pyramid of Biomass
Pyramid of Energy
Pyramid of Number
A pyramid of numbers focuses on the count of individual organisms at each trophic level. Typically:
The base (the widest level) is occupied by producers (like plants or algae), which are often extremely numerous.
The next level is formed by primary consumers (herbivores), followed by secondary and tertiary consumers.
Most of the time, a pyramid of numbers is upright because there tend to be more producers than consumers in healthy ecosystems. However, certain ecosystems—such as those dominated by trees, or detritus-based food chains—may show inverted or partially inverted pyramids. For instance, a single large tree can support numerous insects, creating a top-heavy shape.
Pyramid of Biomass
The pyramid of biomass compares the total dry weight (or living organic matter) of organisms at each trophic level. Here:
Producers usually form the heaviest bulk of living matter in an ecosystem, so they create a broad base.
Consumers tend to have less total biomass at higher trophic levels.
Like the pyramid of numbers, the pyramid of biomass is often upright. However, in certain marine ecosystems, you might find an inverted shape. This happens when a smaller mass of phytoplankton (the producers) supports a much larger mass of zooplankton (the primary consumers) at any given moment. Over time, the high turnover rate of phytoplankton still sustains the food chain, even though their “snapshot” biomass is relatively small.
Pyramid of Energy
A pyramid of energy shows the flow of energy at different trophic levels within a specified period, often measured in kilocalories (kcal) or joules (J). This is the only type of ecological pyramid that is always upright because energy flows in a single direction—from producers up to various levels of consumers—and at each transfer, some energy is lost as heat.
First Trophic Level (Producers): They capture energy from the sun (via photosynthesis) or chemicals (via chemosynthesis).
Higher Trophic Levels (Consumers): Herbivores, carnivores, and omnivores derive energy by feeding on organisms at lower levels. At each step, around 10% (the “10% law” described by Raymond Lindeman) of the energy is passed on to the next level, while the rest is lost primarily as heat or through metabolic processes.
Energy Pyramid Examples
To clarify how energy decreases at each step, here are a couple of common energy pyramid examples:
Grassland Ecosystem
Producers: Grasses and small shrubs capturing sunlight
Primary Consumers: Grasshoppers, rabbits
Secondary Consumers: Snakes, foxes
Tertiary Consumers: Hawks or eagles
At each level, the available energy becomes progressively smaller.
Aquatic Ecosystem
Producers: Phytoplankton (microscopic algae)
Primary Consumers: Zooplankton
Secondary Consumers: Small fish
Tertiary Consumers: Large predatory fish (e.g., tuna), and sometimes apex predators like sharks
Again, the flow of energy follows a unidirectional path, with most energy lost as heat at every step.
Importance of Ecological Pyramids in the Ecosystem
Studying ecological pyramids in the ecosystem is vital for the following reasons:
Clear Visualisation: They offer a quick and clear way to understand the structure of food chains and the distribution of energy or biomass.
Ecosystem Health Monitoring: Changes in the shape or stability of these pyramids can indicate ecosystem imbalances (e.g., overfishing, and deforestation).
Energy Transfer Efficiency: The 10% law and the shape of the pyramid of energy highlight how little energy is transferred from one level to the next.
Conservation & Management: By understanding which trophic levels are most vulnerable, conservationists can intervene more effectively to preserve biodiversity.
Read More: Conservation of Biodiversituy
Limitations of the Ecological Pyramid
Although ecological pyramids are a powerful tool for visualising trophic relationships, there are a few limitations of the ecological pyramid approach:
Complex Food Webs: Natural ecosystems rarely form simple chains. They consist of interconnected food webs. A single species can occupy multiple trophic levels (e.g., omnivores).
Exclusion of Decomposers: Decomposers or saprophytes are often left out of the classic pyramid model, even though they play an essential role in recycling nutrients.
No Seasonal or Climatic Variations: Pyramids typically offer a “snapshot” view and may not account for seasonal fluctuations or climate changes.
Inverted or Partially Inverted Pyramids: Some ecosystems (e.g., aquatic systems) may have an inverted pyramid of biomass, confusing one-size-fits-all diagrams.
Quantification Challenges: Measuring biomass and energy flow accurately can be difficult, leading to data gaps or high margins of error.
Additional Insights & Quick Facts
Raymond Lindeman’s 10% Law: This principle states that only about 10% of energy is transferred to each successive trophic level. This underpins why the pyramid of energy always narrows sharply.
Productivity vs. Standing Crop: While the pyramid of biomass measures “standing crop” at a given time, a pyramid of productivity (a variation of the energy pyramid) measures the rate at which biomass is produced over time.
Human Impact: Overharvesting at higher trophic levels (like large fish in oceans) can disrupt the natural shape of the pyramid, threatening ecosystem stability.
Omnivores & Mixed Diets: Humans, bears, and some other animals can feed at multiple trophic levels, illustrating how complex real-world food webs can be.
By including these additional details, you gain a more accurate picture of how ecological pyramids in the ecosystem behave in real-world scenarios.
Also Check:


FAQs on Different Types of Ecological Pyramids in Ecosystems
1. What are the different types of ecological pyramids?
The three main types of ecological pyramids are the pyramid of numbers, pyramid of biomass, and pyramid of energy. These pyramids represent different aspects of trophic structure in an ecosystem:
- Pyramid of numbers – shows the number of individual organisms at each trophic level.
- Pyramid of biomass – shows the total mass of living organisms at each trophic level.
- Pyramid of energy – shows the flow of energy through each trophic level over time.
2. What is a pyramid of numbers in ecology?
A pyramid of numbers is an ecological pyramid that shows the number of individual organisms present at each trophic level in a food chain. It illustrates population size at different levels:
- Producers usually form the base.
- Primary, secondary, and tertiary consumers form higher levels.
3. What is a pyramid of biomass?
A pyramid of biomass represents the total dry mass of living organisms at each trophic level in an ecosystem. Biomass is usually measured in grams per square meter (g/m²).
- Producers typically have the highest biomass in terrestrial ecosystems.
- In some aquatic ecosystems, it can be inverted due to rapid turnover of phytoplankton.
4. What is a pyramid of energy?
A pyramid of energy shows the amount of energy transferred at each trophic level per unit area per unit time. It is always upright because energy decreases at each successive level due to heat loss and metabolic activities.
- Measured in units like kJ/m²/year.
- Demonstrates the 10% law of energy transfer.
5. Why is the pyramid of energy always upright?
The pyramid of energy is always upright because energy decreases at each trophic level due to loss as heat during respiration and metabolism. According to the law of thermodynamics:
- Only about 10% of energy is transferred to the next trophic level.
- The remaining energy is lost as heat or used in life processes.
6. Can a pyramid of numbers be inverted?
Yes, a pyramid of numbers can be inverted when the number of producers is less than the number of consumers. This occurs in cases such as:
- A single tree supporting many herbivorous insects.
- Parasitic food chains where many parasites live on one host.
7. Can a pyramid of biomass be inverted?
Yes, a pyramid of biomass can be inverted, especially in aquatic ecosystems. In marine systems:
- Phytoplankton have low standing biomass.
- They reproduce rapidly and support larger biomass of zooplankton.
8. What is the difference between pyramid of numbers, biomass, and energy?
The difference between the three types of ecological pyramids lies in what they measure at each trophic level.
- Pyramid of numbers – measures number of individuals.
- Pyramid of biomass – measures total dry mass of organisms.
- Pyramid of energy – measures energy flow over time.
9. Which ecological pyramid is considered the most accurate and why?
The pyramid of energy is considered the most accurate ecological pyramid because it reflects the actual flow of energy through an ecosystem. It:
- Accounts for energy loss at each trophic level.
- Cannot be inverted.
- Shows productivity over time.
10. What is the importance of ecological pyramids in understanding ecosystems?
Ecological pyramids are important because they show the structure and functioning of an ecosystem in terms of trophic levels. They help to:
- Understand energy flow and food chains.
- Analyze population relationships between producers and consumers.
- Study ecosystem stability and productivity.


