


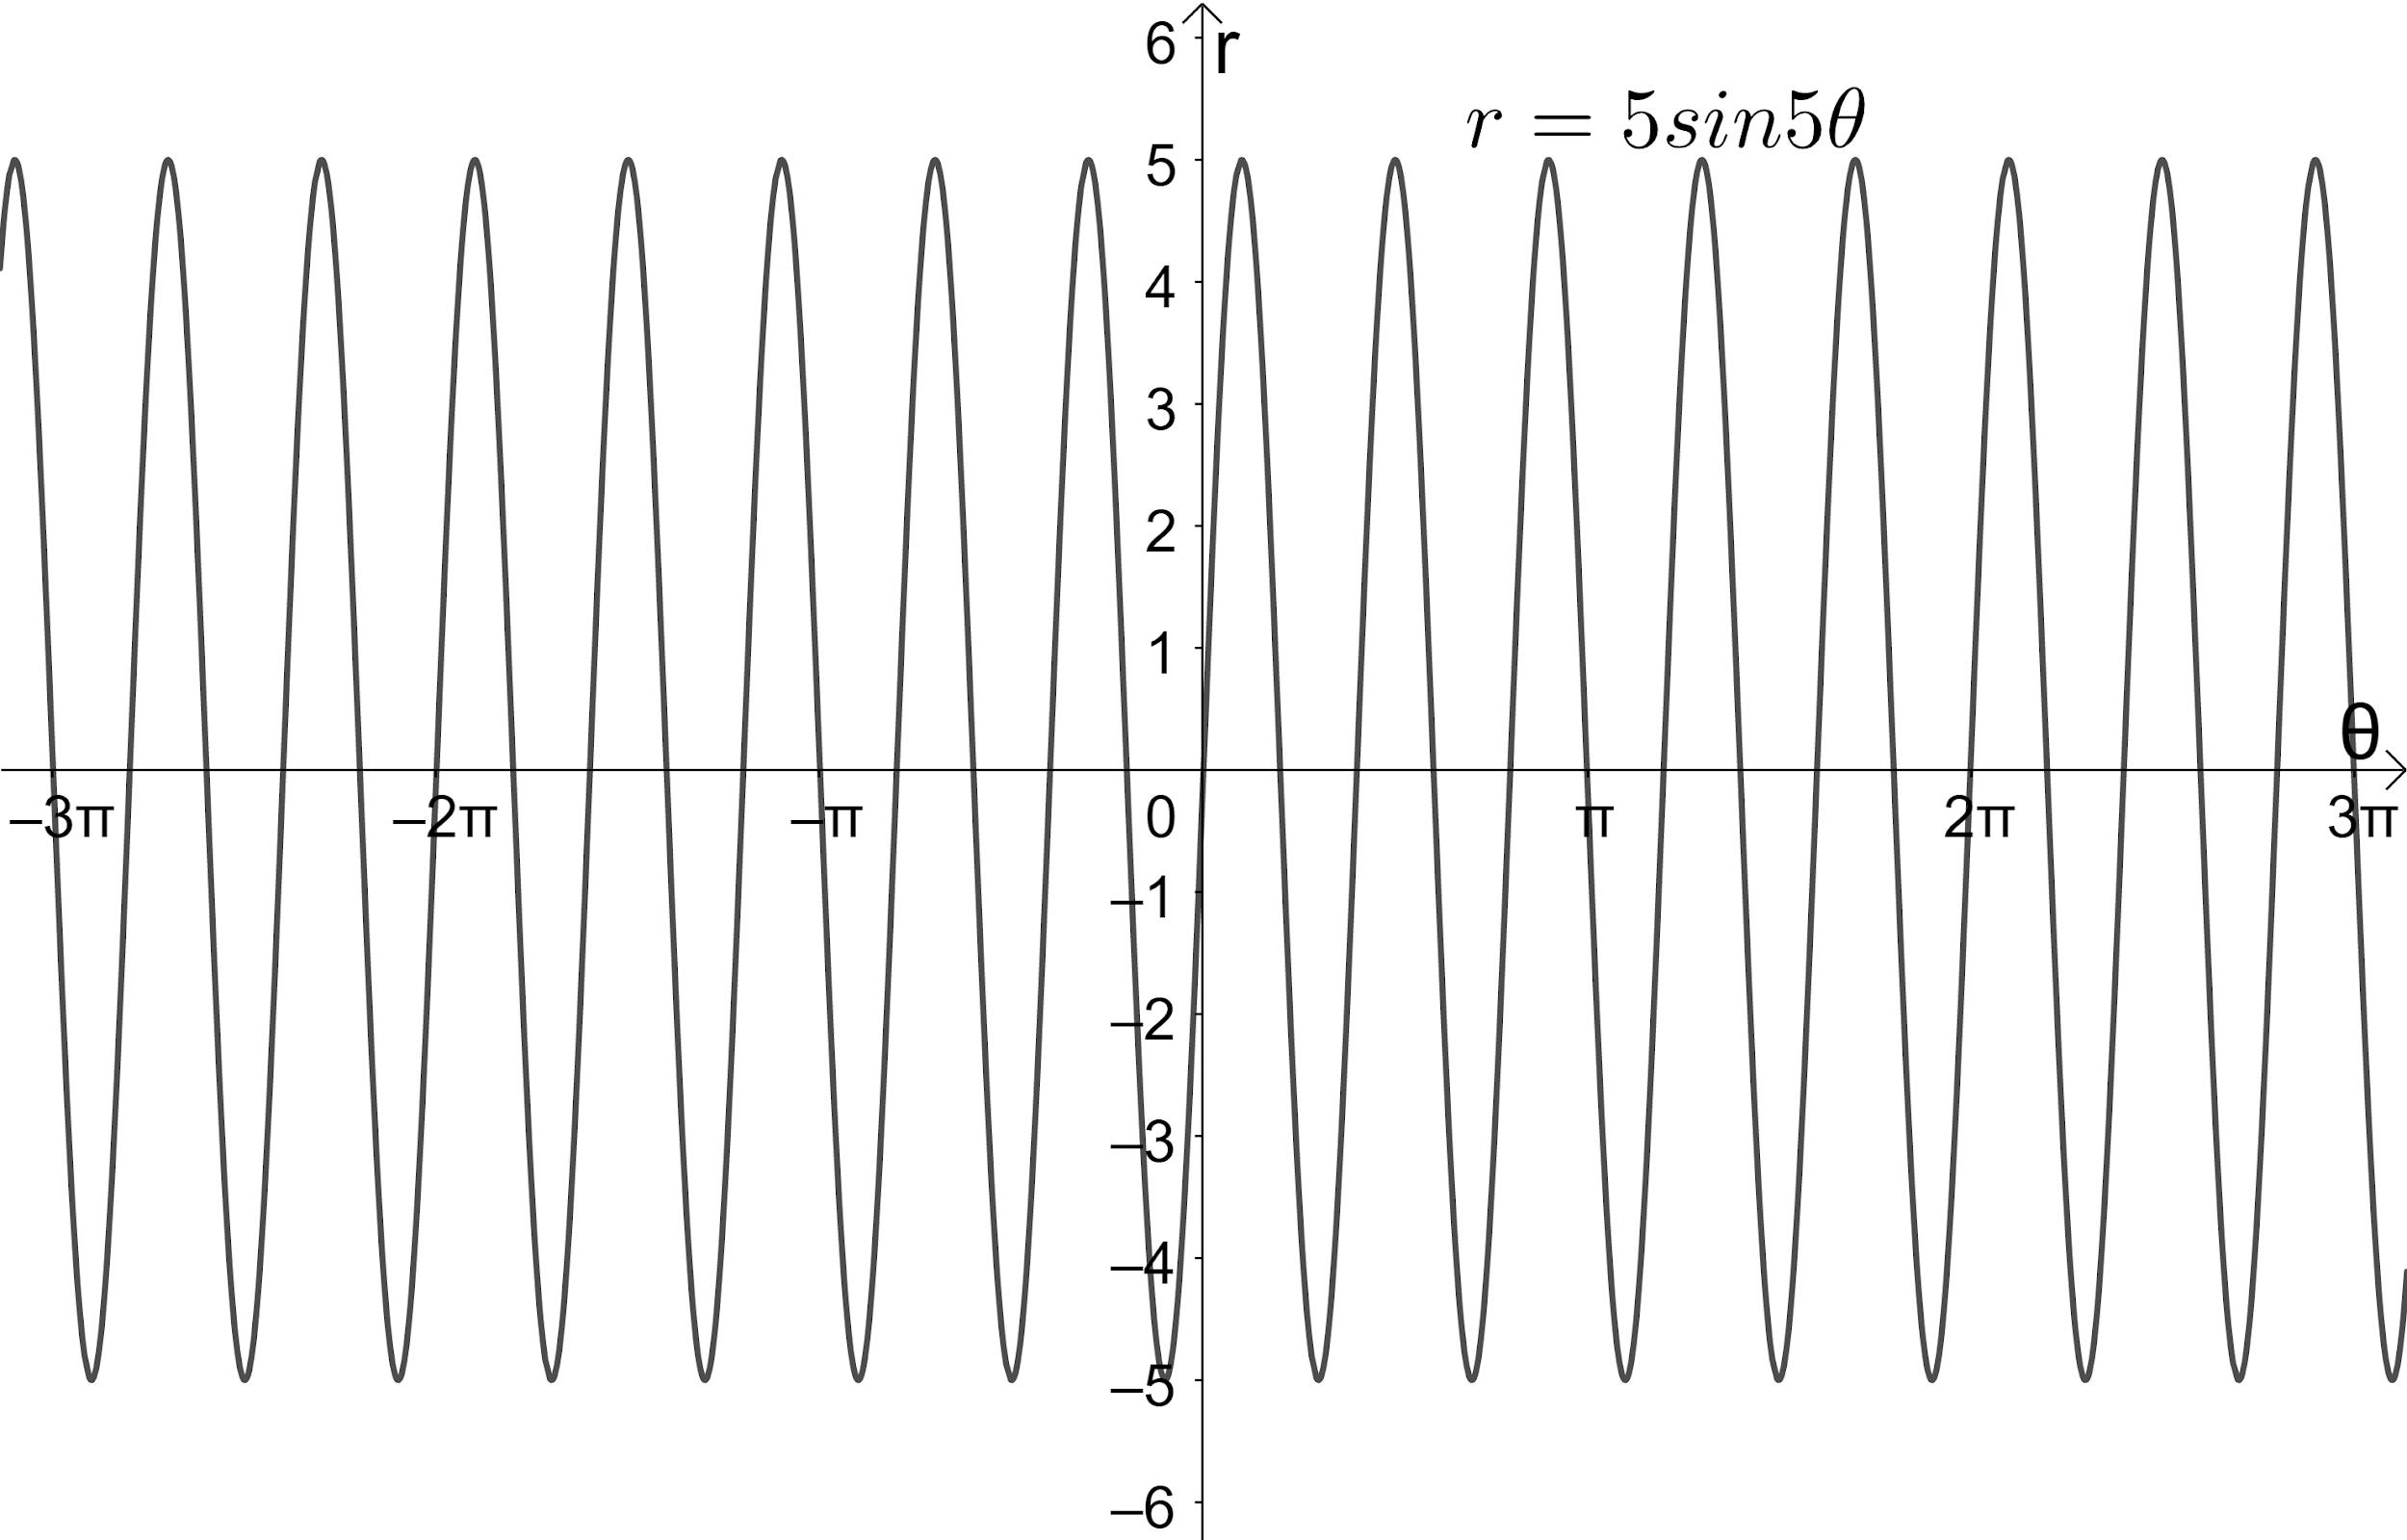
How do you graph the given function $ r=5\sin 5\theta $ ?
Answer
562.2k+ views
Hint: We start solving the problem by finding the maximum and minimum values of the function using the fact that the values of the function $ a\sin bx $ lies in the interval $ \left[ -a,a \right] $ . We then make use of the fact that the maximum value of the function $ a\sin bx $ occurs at $ bx=\left( 4n+1 \right)\dfrac{\pi }{2} $ , $ n\in \mathbb{Z} $ to find the values of $ \theta $ at which we get the maximum values of the given function. We then make use of the fact that that the minimum value of the function $ a\sin bx $ occurs at $ bx=\left( 4n-1 \right)\dfrac{\pi }{2} $ , $ n\in \mathbb{Z} $ to find the values of $ \theta $ at which we get the minimum values of the given function. We then make use of the fact that that the function $ a\sin bx $ is equal to 0 at $ bx=n\pi $ , $ n\in \mathbb{Z} $ to find the values of $ \theta $ at which the given function is equal to 0. We then plot all the obtained points to get the required graph.
Complete step by step answer:
According to the problem, we are asked to plot the given function $ r=5\sin 5\theta $ on a graph.
So, we have the function $ r=5\sin 5\theta $ ---(1).
We know that the values of the function $ a\sin bx $ lies in the interval $ \left[ -a,a \right] $ .
So, the values of the function $ r=5\sin 5\theta $ lies in the interval $ \left[ -5,5 \right] $ .
We know that the maximum value of the function $ a\sin bx $ occurs at $ bx=\left( 4n+1 \right)\dfrac{\pi }{2} $ , $ n\in \mathbb{Z} $ .
So, the maximum value of the function $ r=5\sin 5\theta $ occurs at $ 5\theta =\left( 4n+1 \right)\dfrac{\pi }{2}\Leftrightarrow \theta =\left( 4n+1 \right)\dfrac{\pi }{10} $ , $ n\in \mathbb{Z} $ ---(1).
We know that the minimum value of the function $ a\sin bx $ occurs at $ bx=\left( 4n-1 \right)\dfrac{\pi }{2} $ , $ n\in \mathbb{Z} $ .
So, the minimum value of the function $ r=5\sin 5\theta $ occurs at $ 5\theta =\left( 4n-1 \right)\dfrac{\pi }{2}\Leftrightarrow \theta =\left( 4n-1 \right)\dfrac{\pi }{10} $ , $ n\in \mathbb{Z} $ ---(2).
We know that the function $ a\sin bx $ is equal to 0 at $ bx=n\pi $ , $ n\in \mathbb{Z} $ .
So, the value of the function $ r=5\sin 5\theta $ is 0 at $ 5\theta =n\pi \Leftrightarrow \theta =\dfrac{n\pi }{5} $ , $ n\in \mathbb{Z} $ ---(3).
Now, let us plot the points obtained at all the points obtained from equations (1), (2), and (3) to get the required graph which is as shown below.
Note:
We should not confuse the general solution for the minimum and maximum values of the function $ a\sin bx $ as this will give the wrong graph for us. Whenever we get this type of problem, we first find the points at which we get the minimum, maximum, and 0 to plot the graph. Similarly, we can expect problems to plot the graph of the function $ r=3\cos 6\theta +3\sin 4\theta $.
Recently Updated Pages
Master Class 10 Computer Science: Engaging Questions & Answers for Success
Master Class 10 General Knowledge: Engaging Questions & Answers for Success
Master Class 10 English: Engaging Questions & Answers for Success
Master Class 10 Social Science: Engaging Questions & Answers for Success
Master Class 10 Maths: Engaging Questions & Answers for Success
Master Class 10 Science: Engaging Questions & Answers for Success
Trending doubts
What is the median of the first 10 natural numbers class 10 maths CBSE
Which women's tennis player has 24 Grand Slam singles titles?
Who is the Brand Ambassador of Incredible India?
Why is there a time difference of about 5 hours between class 10 social science CBSE
Write a letter to the principal requesting him to grant class 10 english CBSE
A moving boat is observed from the top of a 150 m high class 10 maths CBSE