


Why Raw Data Matters in Statistics-Key Insights for Exam Success
Data is a sort of information that is used to represent the figures, such as facts and numbers to analyse something and to take decisions on behalf. The data can be read in two terms: raw data in statistics and raw data in mathematics.
Raw Data
Raw Data in Statistics
In statistics, raw data can be defined as the data that has been collected directly from a primary source of data that is not processed or cleaned by anyone. The first step is to collect the data from the primary source of data and then when the data is gathered, it can be cleaned and summarised in various forms.
Terms Related to Statistics
Data: The collection of information in the form of numbers is known as data.
Observation: All the collection of numerical facts in given data is known as observation.
Array: Putting the raw data in ascending or descending order is known as an array. Example: \[4,8,1,6,5,4\;\;\;\] Array: Keeping the above data in ascending order: \[1,4,4,5,6,8\].
Range: Range is the difference between the highest number and the lowest number. For example, the highest number is 45 and the lowest number is 15. Hence, the range is \[45 - 15 = 30.\]
Raw Data Examples in Statistics
The grades of all the students in a class.
List of music being streamed on the radio.
Amount collected by students for teachers’ day function.
These are the common examples of raw data in statistics. Generally, all the data is used to make a better understanding and make decisions upon it.
Raw Data in Mathematics
The data was collected in an unorganised form. if the data is collected in numerical value, it is quantitative raw data and the data collected by non-numerical values is called qualitative raw data. The given diagram will give you a slightly better understanding about the data and its types in Mathematics.
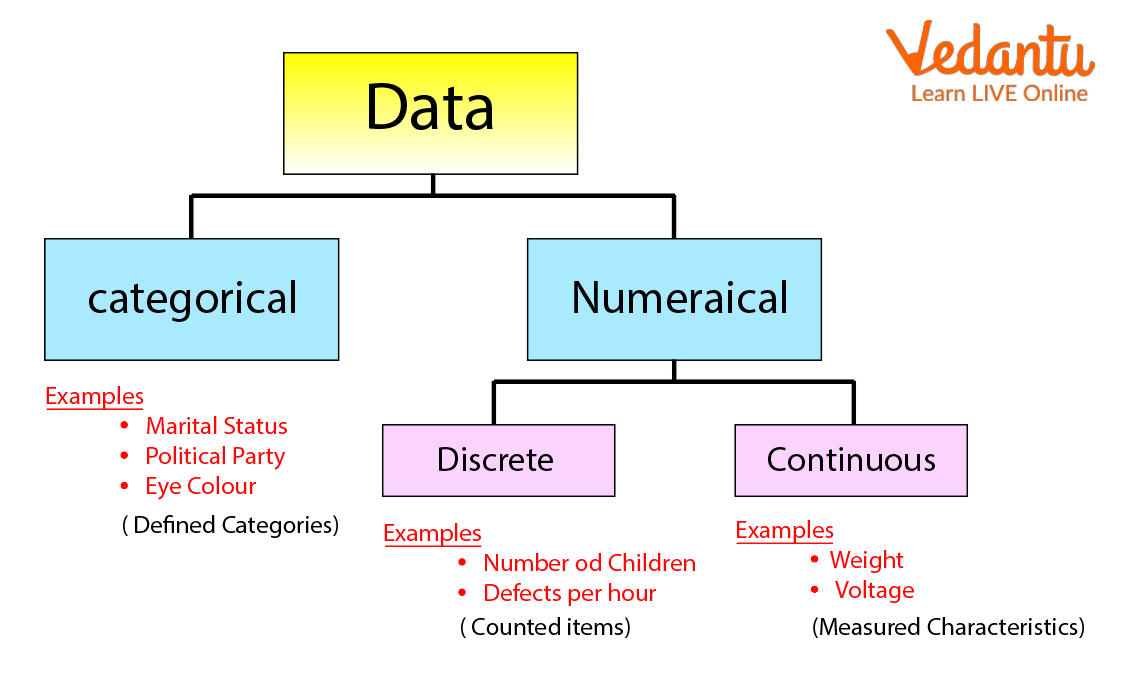
Data
Raw Data Examples in Mathematics
The marks obtained by 5 students in Maths tests: \[45,23,56,45,78\].
The number of apples in one kilogram of apples.
The number of bananas in one dozen bananas.
These all examples can be measured in numerical form.
Solved Questions
1. What is Raw Data?
Raw data is data that has been collected by a primary source. It is the first data collected by using a primary source; it is also known as primary data.
2. Name two terms related to statistics.
The two terms related to statistics are observation and array.
3. What is qualitative data?
The data collected in numerical value means it is quantitative raw data.
4. Give one example of raw data?
The number of apples in one kilogram of apples.
Summary
The raw data is the unorganised data that is collected by the primary source of data. The raw data can be qualitative and quantitative. The raw data can be studied in Statistics or Mathematics. There are many terms in statistics related to raw data. For example, Data, Array, Range etc.
FAQs on Raw Data in Statistics: Definition, Uses & Examples
1. What is meant by raw data in statistics and how is it different from organised data?
Raw data in statistics refers to data collected directly from a primary source that has not yet been processed, organised, or summarised. In contrast, organised data has been arranged, often in tables or arrays, to help in analysis.
2. Why is it important to arrange raw data before analysis in statistics?
Arranging raw data is crucial because it helps to identify patterns, outliers, and trends. Organising the data makes calculations of mean, median, and mode simpler and reduces chances of mistakes in further statistical analysis.
3. Can raw data include both numerical and non-numerical values? Give an example.
Yes, raw data can be quantitative (numerical, like test scores) or qualitative (categorical, like types of music). For example, students' grades (45, 56, 39) are quantitative, while students’ favourite fruits (apple, banana) are qualitative.
4. What is an array in the context of statistics, and how is raw data converted into an array?
An array in statistics means organising raw data in either ascending or descending order. For example, if the raw data is 5, 2, 8, 3, then the array would be 2, 3, 5, 8.
5. How does the range help in understanding variability in a set of raw data?
The range is the difference between the highest and lowest values in the data set. It shows the spread or variability of data, making it easier to see how much values differ within the raw data.
6. How is raw data collected, and why must the source be reliable?
Raw data is collected directly from primary sources such as surveys, experiments, or observations. A reliable source ensures that the data is accurate, which is essential for producing valid results in statistical analysis.
7. What are common misconceptions about raw data in statistical analysis?
A common misconception is that raw data can be directly used for conclusions. In reality, raw data must be processed and analysed before drawing meaningful inferences, as unorganised data can contain errors or outliers.
8. How does raw data in mathematics differ from raw data in statistics?
In mathematics, raw data typically refers to unorganised numerical values, while in statistics it can include both numerical and categorical (qualitative) unprocessed data, used for further statistical analysis.
9. What steps are involved in processing raw data according to the CBSE syllabus?
- Collection: Gather data from primary sources
- Organisation: Arrange into arrays or tables
- Summarisation: Find key measures like mean, median, and range
- Interpretation: Draw conclusions from the organised data
10. Why is understanding raw data foundational for learning advanced statistical concepts?
Understanding raw data is foundational because it forms the basis of all statistical methods. Without accurately collecting and organising raw data, it is impossible to perform meaningful statistical analysis or interpret results correctly.