


How to Plot Points and Draw Graphs on X and Y Axis
A graph paper with an x and y axis is used in mathematics and science to plot and analyse data. The x-axis and y-axis are the two perpendicular lines that intersect at the origin and divide the graph into four quadrants. These lines, also known as the coordinate axes, are used to plot points on the graph. A blank x and y-axis graph is a paper with only the axis drawn, allowing data to be plotted and analysed. The axis of a graph is the set of numerical scales used to measure and plot data on the x and y-axis.

Point in X Axis and Y Axis
What is Graph?
A graph is a graphical representation or chart that represents values or data systematically. Dots on charts often represent relationships between two or more things. Charts such as graph paper with x and y axes are examples.
What is the Axis of the Graph?
An axis on a graph is defined in mathematics as a line used to make or mark measurements. The x-axis and y-axis are the two important lines of the coordinate plane.
X and Y Graph
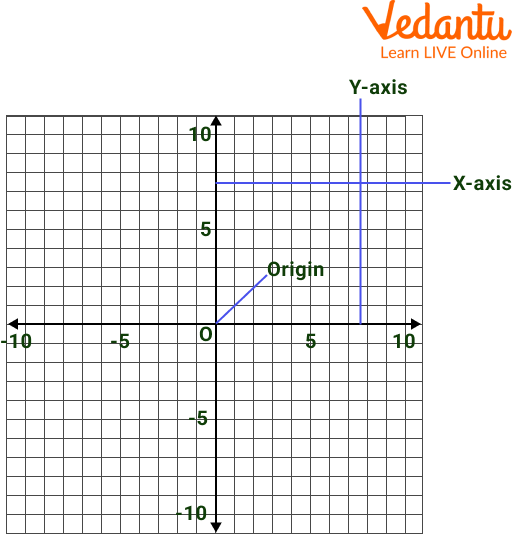
The x-axis is typically horizontal, and the y-axis is typically vertical. Points can be written horizontally or vertically, so you can easily explain them using diagrams. These horizontal and vertical lines or axes on the chart are the x-axis and y-axis graphs, respectively.
An ordered pair unambiguously define every point on the coordinate plane. Ordered pairs are written as (x coordinate, y coordinate) or (x, y). where the x-coordinate is a point on the x-axis. or Perpendicular represents the distance from the y-axis, where the y-coordinate represents a point on the y-axis or perpendicular distance from the x-axis.
The X and Y axes are the axes used in the coordinate system that form the coordinate plane. The horizontal axis is represented by the x-axis, and the vertical axis by the y-axis. The following illustration shows an x and y diagram with positive and negative coordinates.
X and Y Axis
Equation of Y-Axis
The y-axis is the line whose x-coordinate value is zero for all y-values. Then the y-axis data points are (0, 4), (0, 2), (0, 1), (0, -2). So the y-axis equation is x = 0, and its plot on the x and y charts is: You can find the y coordinate in the general formula y = mx + c by replacing the x value with 0.
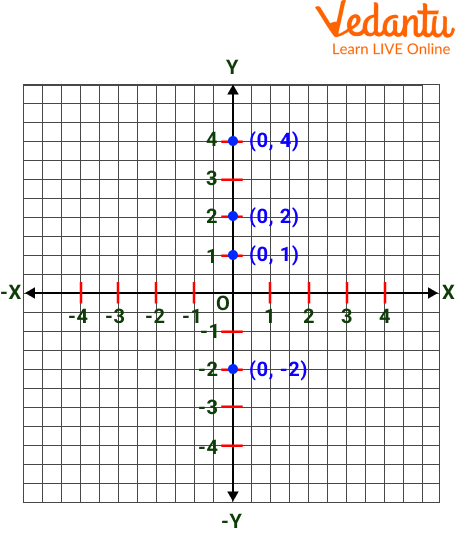
Plotting of the Y-Axis
Equation of X-axis
The x-axis is the line whose y-coordinate value is zero for all x-values. The x-axis data points are (1,0), (-2, 0). So the x-axis equation is y = 0, and its plot on the x and y graph looks like this: You can find the x coordinate by replacing the y value with 0 in the general formula y = mx + c.
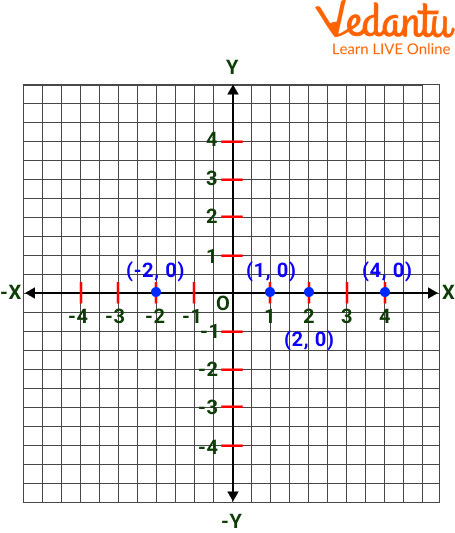
Plotting of X Axis
What is the Coordinate Plane?
Every point on the coordinate plane is unambiguously defined by an ordered pair. Ordered pairs are written as (x coordinate, y coordinate) or (x, y). where the x-coordinate is a point on the x-axis. or Perpendicular represents the distance from the y-axis, where the y-coordinate represents a point on the y-axis or perpendicular distance from the x-axis.
The X and Y axes are the axes used in the coordinate system that form the coordinate plane. The x-axis and the vertical-axis by the y-axis represent the horizontal axis. X and Y axis interaction is known as the origin and serves as the reference point for the plane. There are 4 quadrants in the graph.
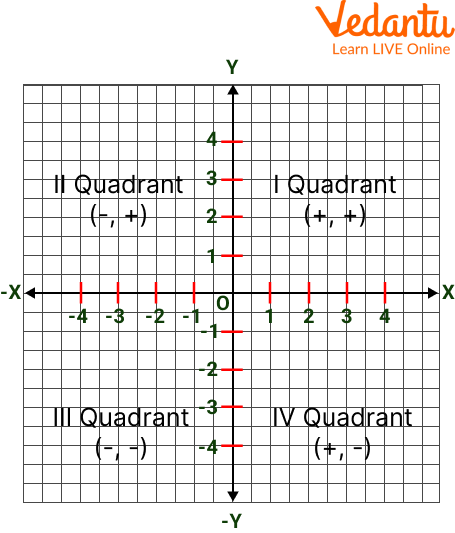
Quadrants
Locating a Point on the Coordinate Plane
Now that we understand coordinate planes and their parts, let's discuss how to locate points on coordinate planes. To find a point on the coordinate plane:
Step 1: Find a point.
Step 2: Find the quadrant by looking at the signs of the X and Y coordinates.
Step 3: Read the number of units the point is to the right/left of the origin along the X axis to find the X of the point.
Step 4: Find the y of the point by reading the number of units the point is above/below the origin along the y-axis.
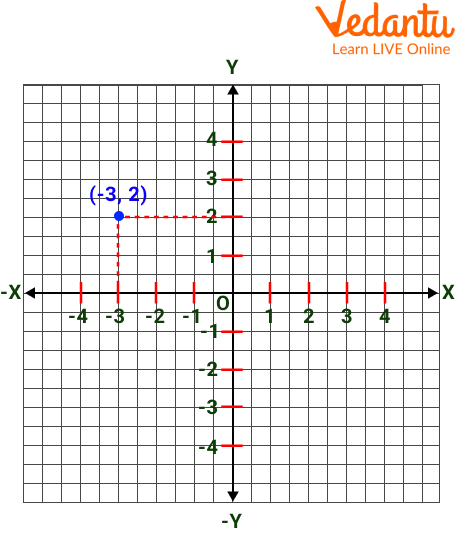
To find a point on the coordinate plane, see the diagram and steps below.
Step 1: Observe the blue dot on the coordinate map.
Step 2: Located in the second quadrant.
Step 3: The point is 3 units from the origin along the negative X axis.
Step 4: The point is 2 units from the origin along the positive Y axis.
Intersection Point of the X and Y Axis
Plotting Points on a Coordinate Plane
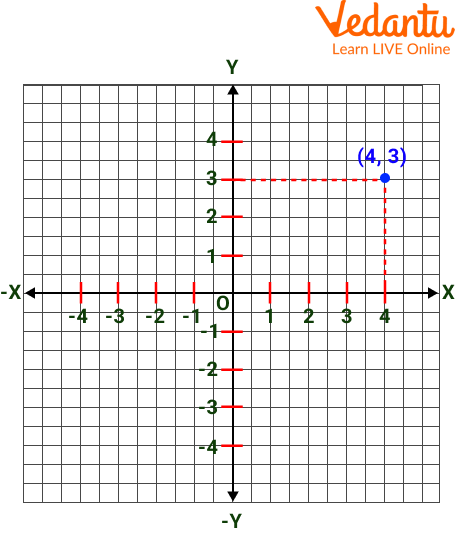
In this section, you will learn how to draw points on the coordinate plane. Let's take the example of the point P = (4, 3). To draw a point on the coordinate plane:
Step 1: Draw two perpendicular lines for the X and Y axes.
Step 2: Start from the origin. Move 4 units to the right along the Positive(+ve) X axis.
Step 3: Move up 3 units along the positive Y axis.
Step 4: Mark the intersection. Mark as (4, 3).
Intersection Point of X and Y Axis
Solved Question
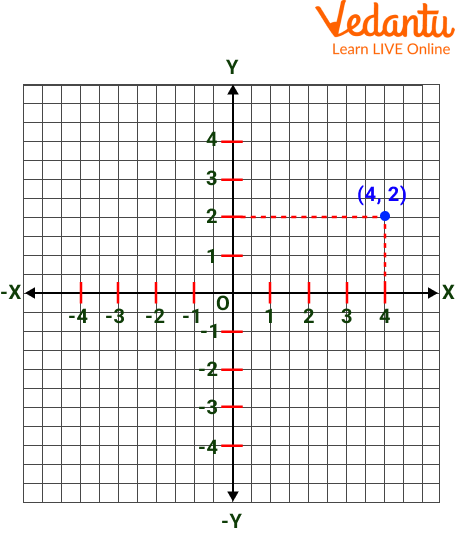
1. Plot X= 4 Y= 2 in the first quadrant.
Solved Question
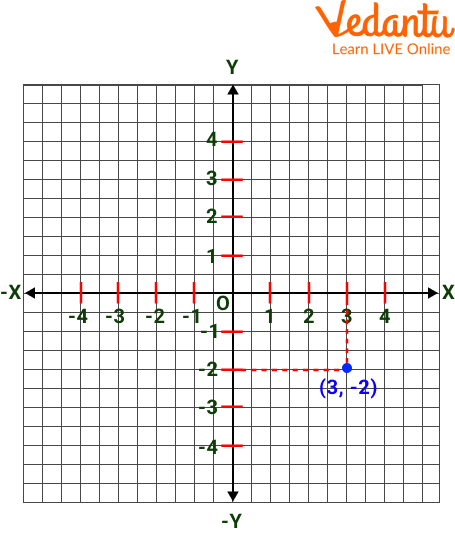
2. Plot the point on graph: P(3, -2)
Solved Question
Practice Question
1. Plot X= +2 Y= -2
2. Plot X= -2 Y= +4
Answers:
1.

Practice Question
2.
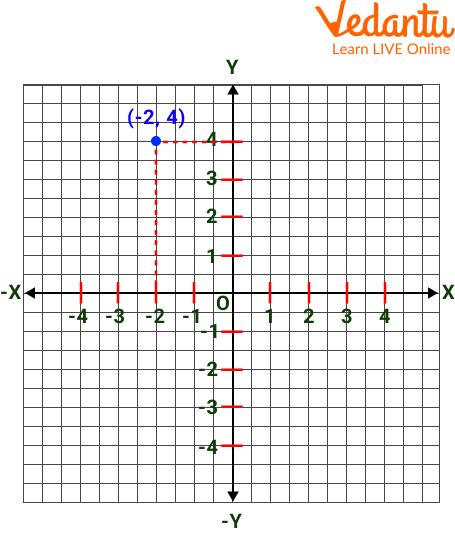
Practice Question
Summary
In this article, we have learned about graphs, and we also read about the axis of the graph, y-graph and x-graph, also known as the y-axis and x-axis are the two important lines that make up a graph. A graph consists of horizontal and vertical axes on which data can be plotted. And also learned about the coordinate plane, a two-dimensional plane formed by the intersection of the x-axis (horizontal line) and the y-axis (vertical line). We also solved some examples on this and some questions for practice will help you to solve quickly.
FAQs on Graph Paper with X and Y Axis Explained
1. What are the x-axis and y-axis on a graph paper?
The x-axis and y-axis are the two perpendicular lines that create the framework for a Cartesian coordinate system on graph paper. The horizontal line is the x-axis (also known as the abscissa), and the vertical line is the y-axis (also known as the ordinate). Their point of intersection is called the origin, with coordinates (0,0).
2. What is the main purpose of using an x-axis and a y-axis in Maths?
The primary purpose of the x and y axes is to provide a visual system for defining and plotting the position of points in a two-dimensional plane. This is essential for:
- Graphing equations and functions.
- Representing the relationship between two variables, such as time and distance.
- Solving geometric problems and understanding shapes.
3. How do you plot a point with coordinates like (5, -2) on a graph?
To plot the point (5, -2), you start at the origin (0,0). First, you look at the x-coordinate, which is 5. You move 5 units to the right along the x-axis. Next, you look at the y-coordinate, which is -2. From your position at x=5, you move 2 units down, parallel to the y-axis. The location where you stop is the point (5, -2).
4. What are the four quadrants on a graph with x and y axes?
The x and y axes divide the flat plane of the graph paper into four distinct sections called quadrants. They are numbered counter-clockwise from the top right:
- Quadrant I: Here, both the x and y coordinates are positive (+, +).
- Quadrant II: Here, the x-coordinate is negative, and the y-coordinate is positive (-, +).
- Quadrant III: Here, both the x and y coordinates are negative (-, -).
- Quadrant IV: Here, the x-coordinate is positive, and the y-coordinate is negative (+, -).
5. What does it mean if a point lies directly on the x-axis or y-axis?
If a point lies directly on the x-axis, its vertical distance from the origin is zero, which means its y-coordinate is always 0 (e.g., (4, 0)). If a point lies directly on the y-axis, its horizontal distance from the origin is zero, so its x-coordinate is always 0 (e.g., (0, 3)). These points do not belong to any specific quadrant.
6. How do the x and y axes help in understanding real-world data?
In real-world applications, the x and y axes represent two different variables, showing how one affects the other. For example, in a graph showing rainfall over a year, the x-axis could represent the months (the independent variable), and the y-axis could represent the rainfall amount in mm (the dependent variable). This helps us visually identify trends, like the rainiest month of the year.
7. Why is the order of coordinates in a pair like (3, 7) so important?
The order is critical because coordinates form an ordered pair where the first number always refers to the x-axis position and the second number always refers to the y-axis position. The point (3, 7) is a unique location. If you reverse the order to (7, 3), you are describing a completely different location on the graph. This strict order ensures that every point has a single, unambiguous address.
8. How do you determine the correct scale to use for the x and y axes?
The correct scale is one that allows all your data points to be clearly plotted and easily read on the graph paper. To determine it, look at the highest and lowest values for both your x and y data. Choose a consistent interval for each axis (e.g., each grid line represents 5 units, 10 units, etc.) that spreads the data across most of the available space. The scales for the x-axis and y-axis can be different from each other.