

Key Concepts and Tips for Drawing Maths Graphs
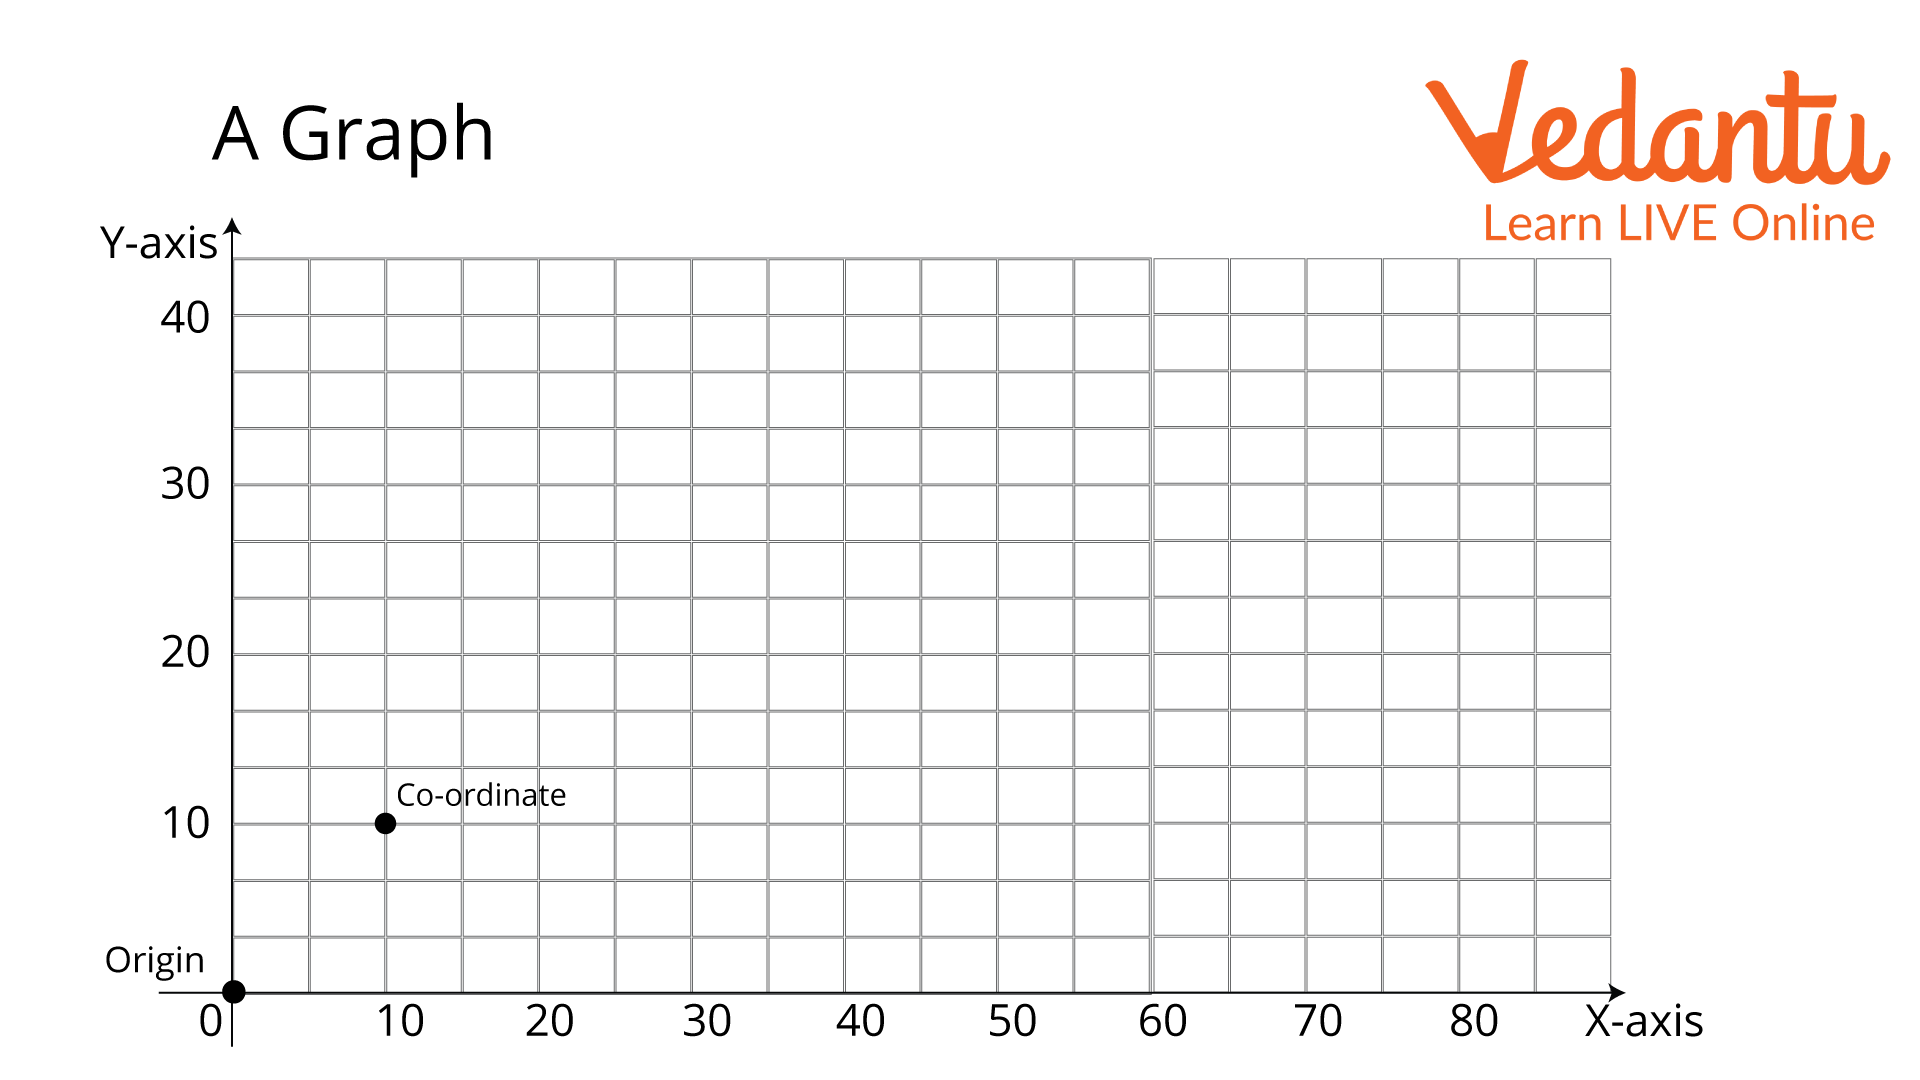
A graph is a diagram that shows the relationship between two different quantities. Varying quantities are the quantities that change with respect to other conditions. In a graph, these varying quantities are represented on two lines called axes. The two axes form a right angle with each other. The two axes are called the X-axis and the Y-axis. Another name for the X-axis is abscissa, and the Y-axis is ordinate.
Now that you have understood the graph and the axes let us move forward to drawing a graph.
A Graph and Its Functions

A Graph
You can observe from the above figure that the horizontal line is labelled as the X-axis or the abscissa, and the vertical line has been labelled as the Y-axis or the ordinate. You can also observe that both are making a right angle with each other. The point where these axes intersect is known as the origin, marked at zero, as shown in the image above. A graph is formed when many coordinates are connected to each other.
Types of Graphs
There are many types of graphs, like bar graphs, column graphs, histograms, frequency polygons, and many more; however, you will need to learn four basic types, which are given below:
Line Graph
In this type of graph, only coordinates are plotted on the graph, and these coordinates are connected together to form a line that is sometimes straight or curved. We will learn to draw a line graph later in this article.
Bar Graph
A bar graph is a chart or the visual representation of any quantity with the help of bars or strips. These bars or strips look like columns.
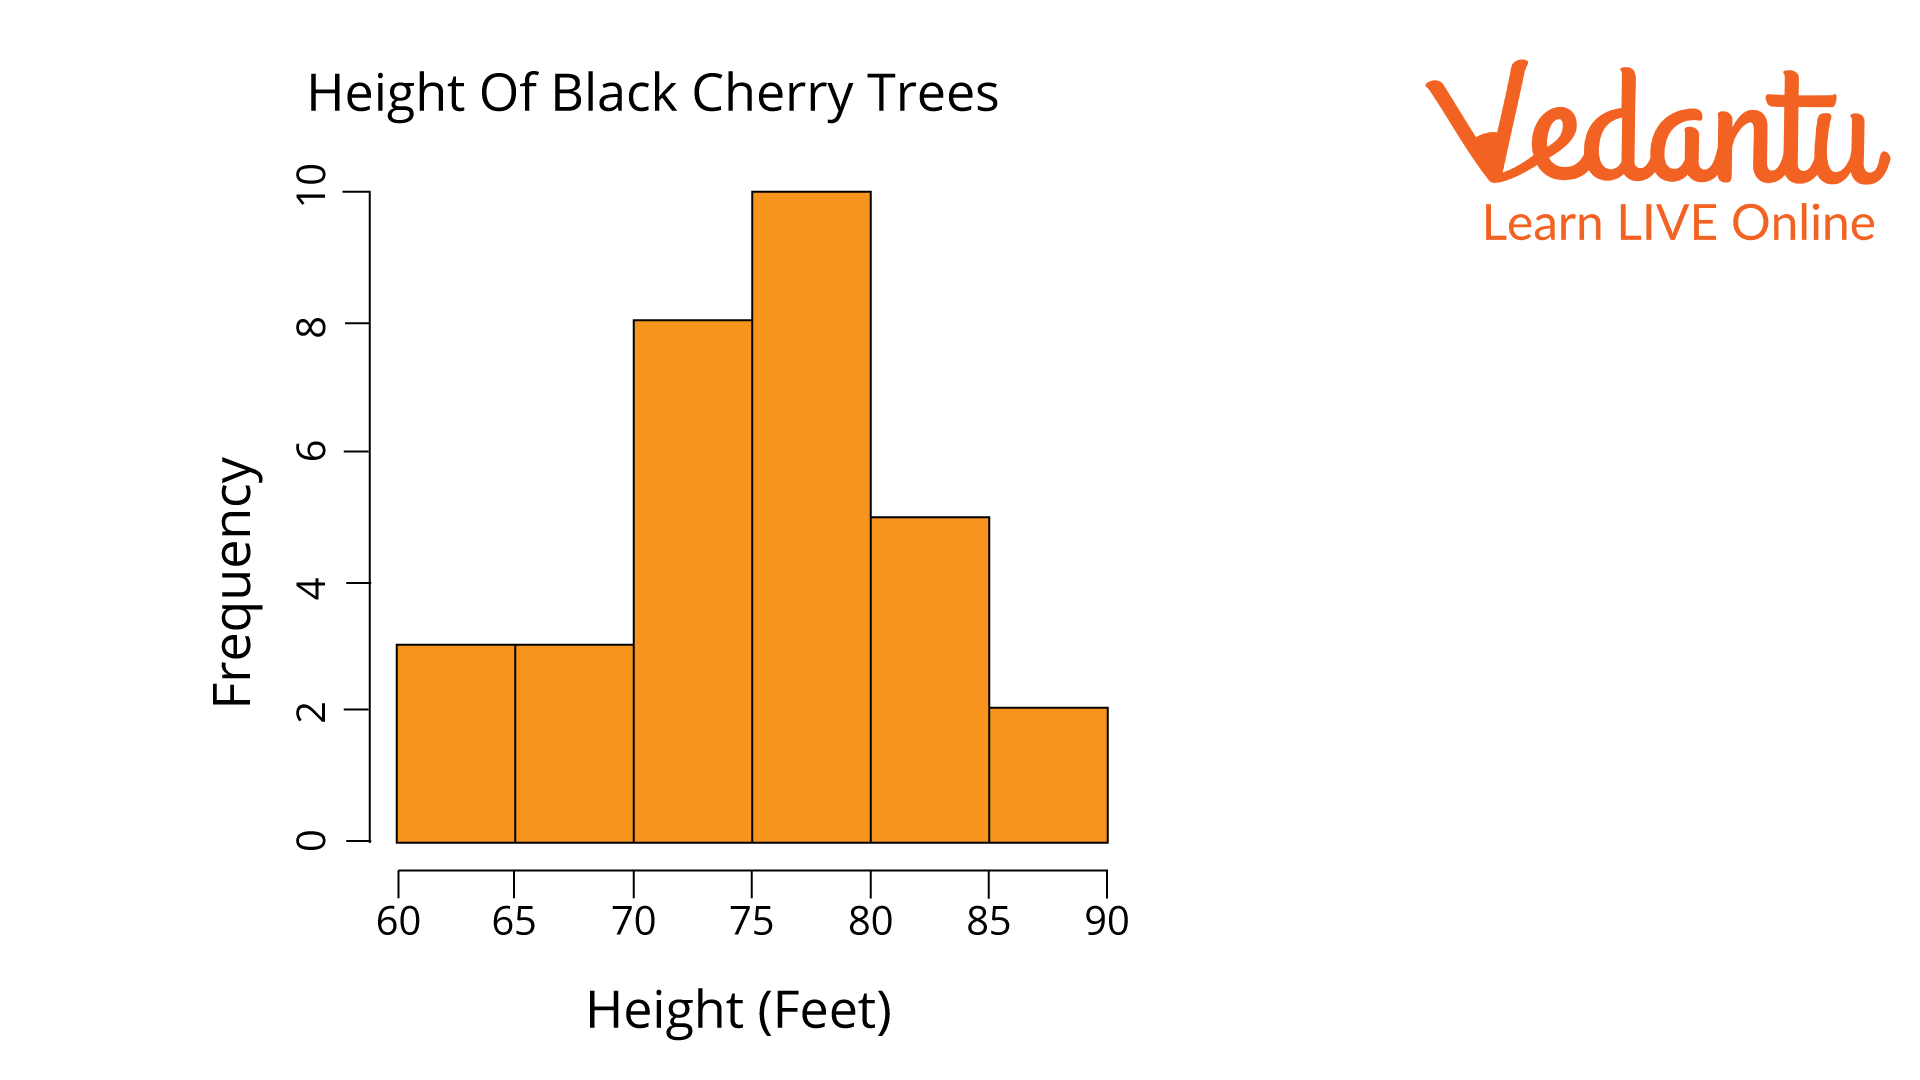
As shown below, a histogram is a bar graph that depicts frequency distribution.

Histogram
Pie Chart
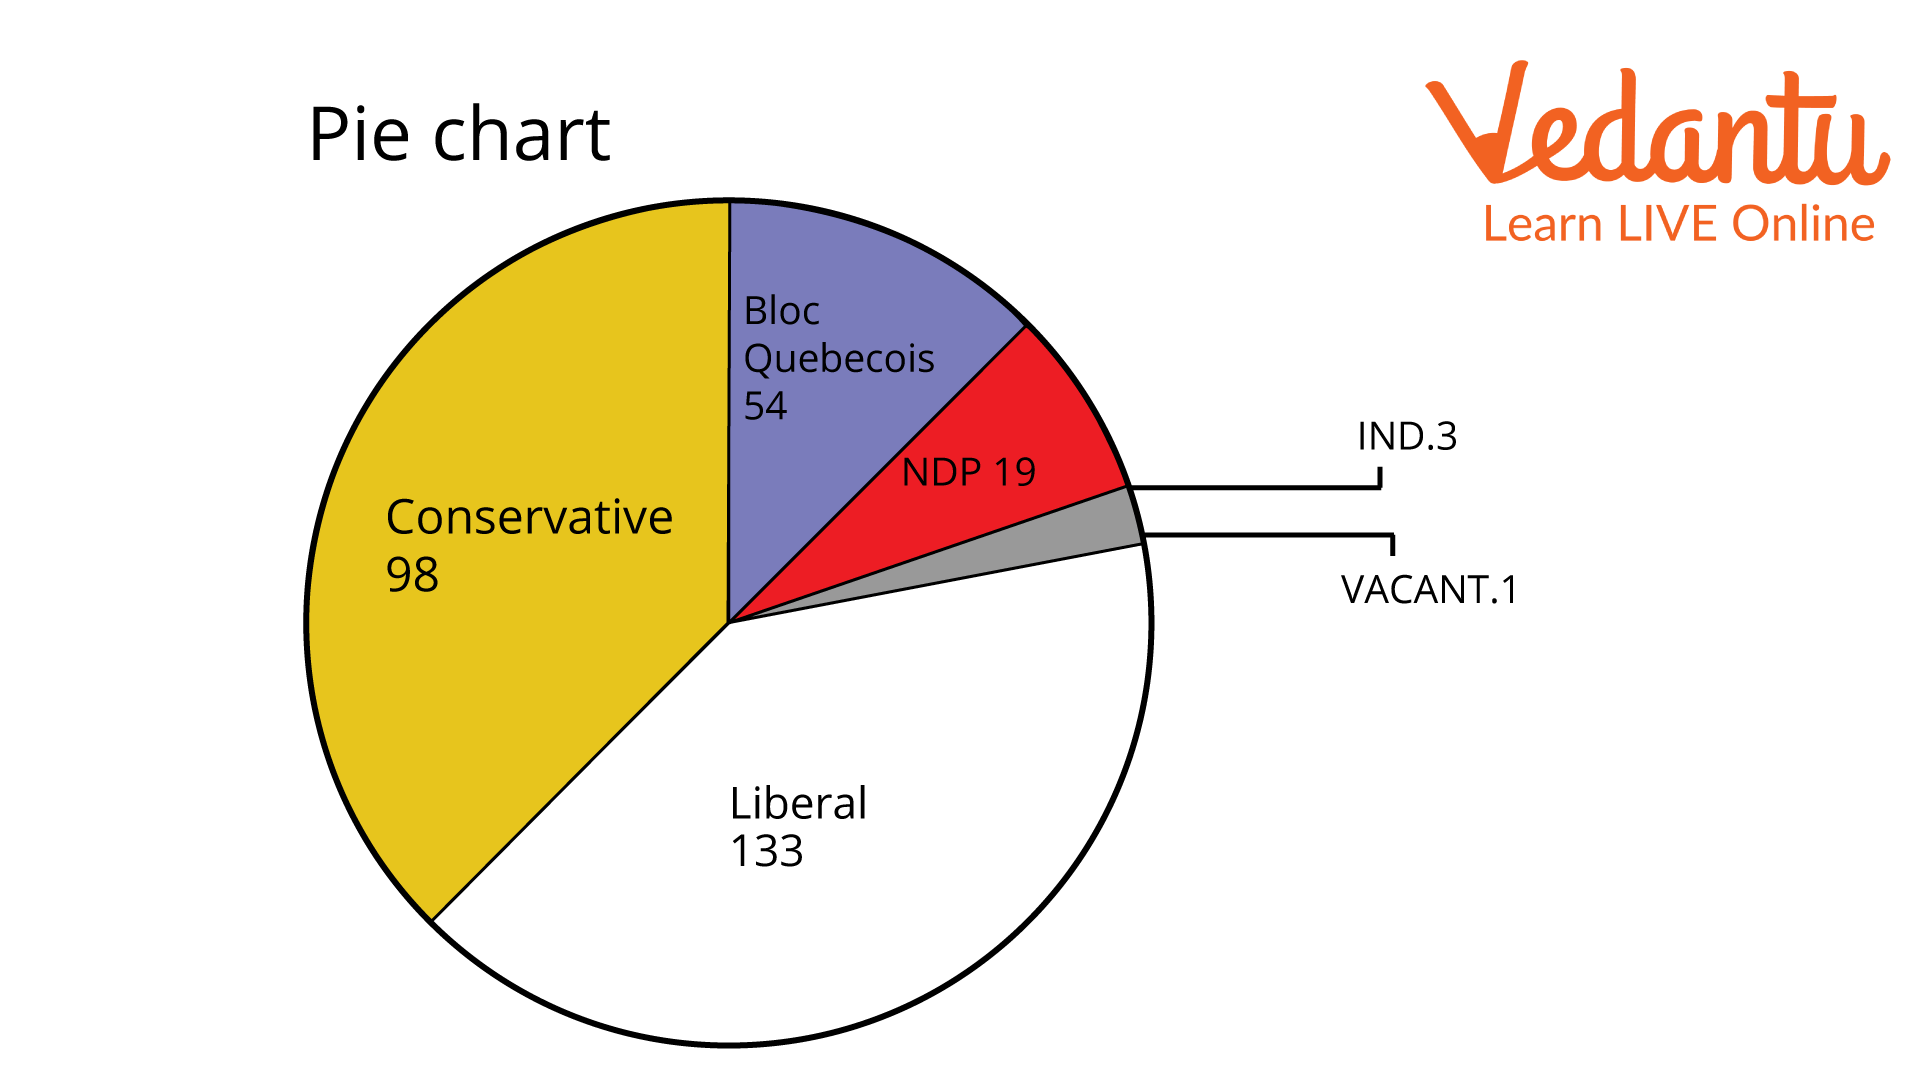
It is a circular figure that is divided into slices to show the proportion of the given quantities. Given below is a representation of a pie chart.

Pie chart
Steps to Draw a Graph
The line graph is the simplest form of a graph. Therefore, before proceeding to draw a graph of various types, you must learn to draw a line graph first. Therefore, let us first start by drawing a graph of x and y coordinates. Let us take an example so that you can understand the steps one by one. The question says, “Draw a graph with the variable y being dependent on the variable x by the relation y = 2x.” Here are the steps based on the example:
Determine the Given Variables
Since the instruction is to “Draw a graph with the variable y being dependent on the variable x by the relation y=2x.” This means that for any value of x, the value of y will be doubled.
Form a Table of X and Y Coordinates
Since you have determined the relationship between the variables, you can form a table of x and y coordinates as shown below.
Table of coordinates
Plot the Point
After you form a table and arrange the given data, plot the points on graph paper.
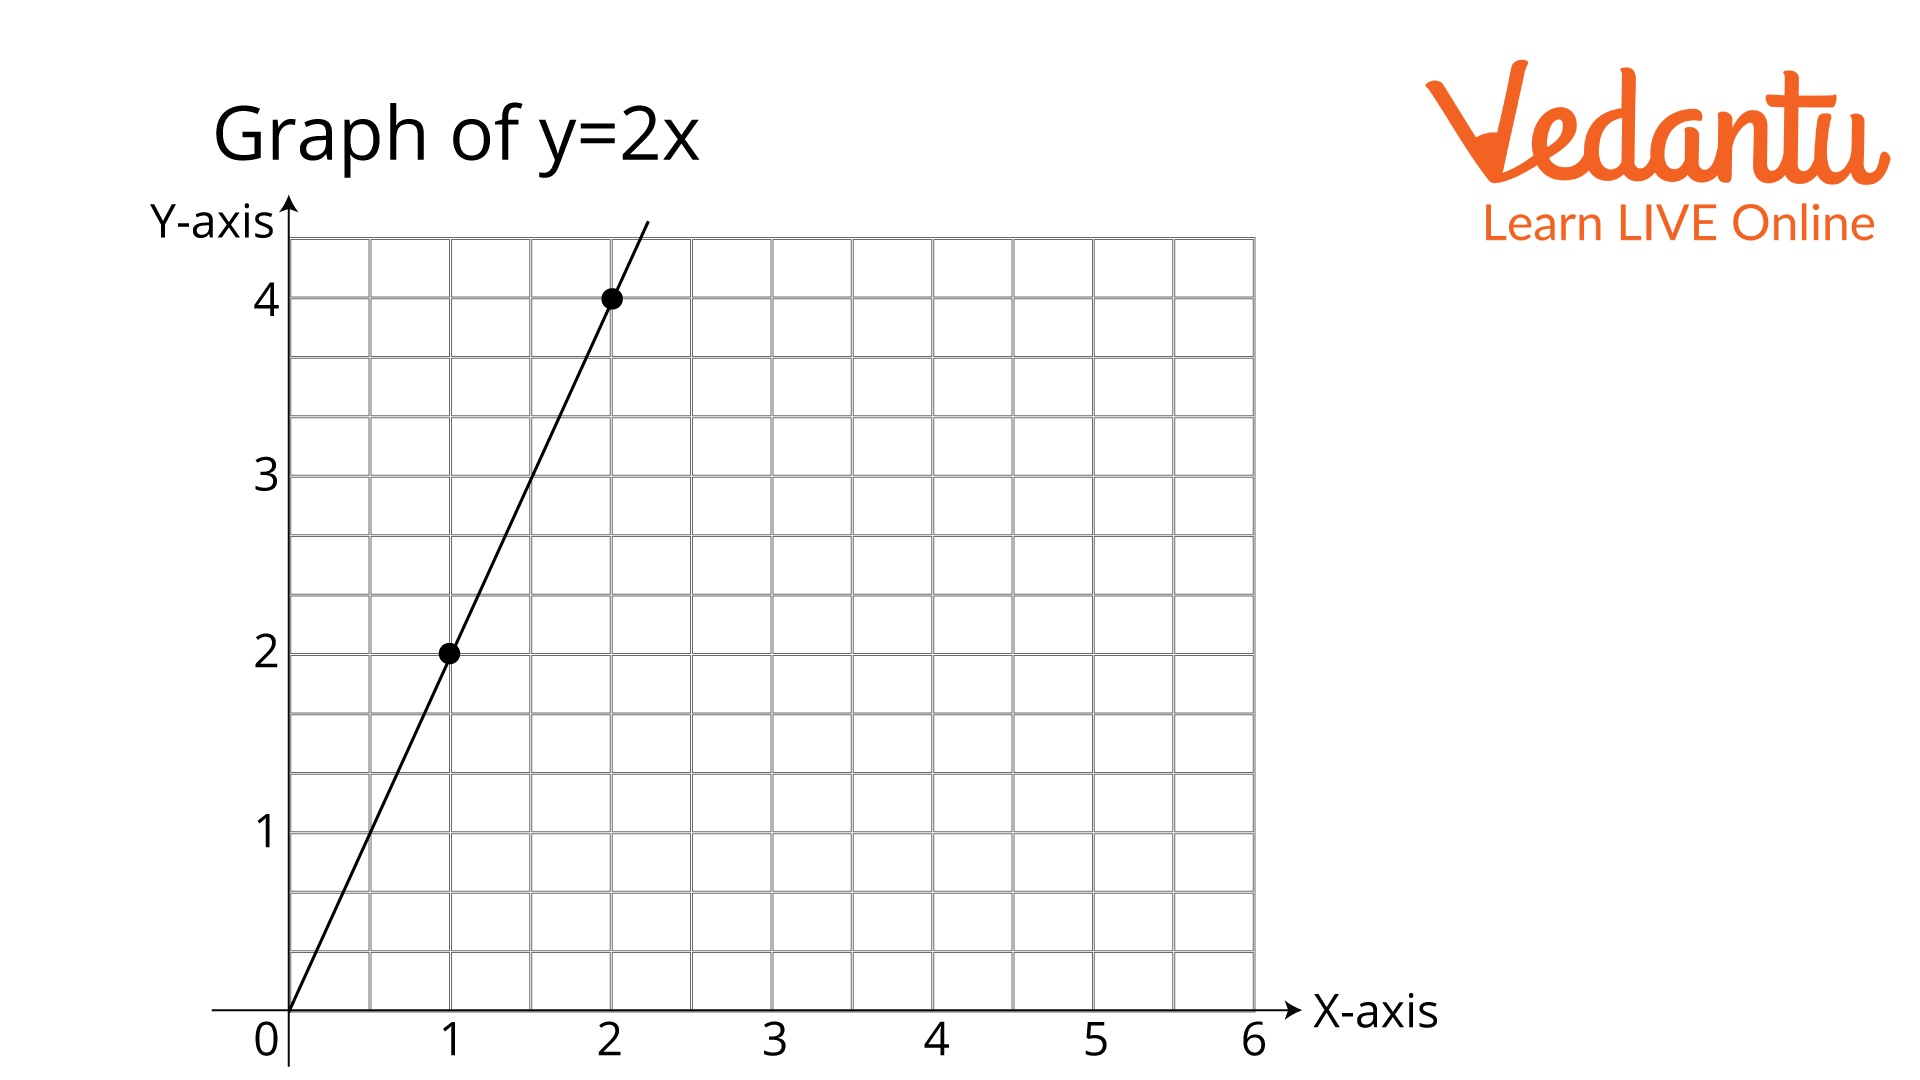
Take the scale of a graph as 1 unit = 10mm for x and 1 unit = 10mm for y. Start with the x coordinate and mark the point for the corresponding value given in the table.

Graph of y=2x (self-made)
Conclusion
This is how you make a line graph. Wasn't it interesting to learn something new about data organisation? So, in this article, you learnt about graphs, graph types, and the two axes. You have also learnt the simple steps for drawing graphs with various data, which are to determine the variables, draw a table of the arranged data, and then draw the diagram. You have also learnt to take the scale of the graph into account when drawing one.
FAQs on Draw a Graph: Easy Methods and Examples
1. What are the essential components needed to draw a graph?
To draw a graph correctly, you need three key components: the horizontal axis (x-axis), the vertical axis (y-axis), and a suitable scale. The scale determines how many units on the graph represent the data values (e.g., 1 cm = 5 runs). You also need the data points, which are pairs of values to be plotted.
2. What is the step-by-step process for drawing a simple line graph?
To draw a line graph, follow these simple steps as per the CBSE 2025-26 syllabus:
- First, draw the x-axis and y-axis on graph paper and label them based on the data (e.g., 'Time' on the x-axis, 'Temperature' on the y-axis).
- Next, choose an appropriate scale for both axes that allows all your data points to fit clearly on the page.
- Plot each data point on the graph using its coordinates (x, y).
- Finally, connect the points sequentially with straight lines to show how the data changes.
3. What is the main difference between a bar graph and a line graph?
The main difference lies in their purpose and the type of data they represent. A bar graph is best for comparing quantities across distinct categories, such as the favourite fruits of students in a class. In contrast, a line graph is ideal for showing how data changes over a continuous interval, like tracking a car's speed over time.
4. How do you plot coordinates like (4, 2) on a graph?
The coordinates (4, 2) represent a specific location on a graph. The first number, 4, is the x-coordinate, and the second number, 2, is the y-coordinate. To plot this point: start at the origin (0,0), move 4 units to the right along the horizontal x-axis, and then move 2 units up, parallel to the vertical y-axis. Mark this final position with a dot.
5. Why is choosing the correct scale for a graph so important?
Choosing the correct scale is crucial because it directly affects the clarity and accuracy of the graph's visual representation. An improper scale can distort the data, making a small change look massive or a significant trend seem flat. A good scale ensures that all data points fit on the graph and that the relationship between them is easy to understand and interpret correctly.
6. How do graphs help in understanding real-world information?
Graphs are powerful tools because they transform lists of numbers into a simple visual format. This helps in quickly identifying trends, patterns, and comparisons that might be difficult to spot in a table. For example, a business can use a line graph to track sales over a year to see seasonal trends, helping them make better decisions for the future.
7. Can a point lie directly on the x-axis or y-axis, and what would its coordinates be?
Yes, a point can lie directly on an axis. If a point is on the x-axis, its y-coordinate will always be zero, for example, (5, 0). If a point is on the y-axis, its x-coordinate will always be zero, such as (0, 3). The special point (0, 0) where both axes intersect is called the origin.


