


Essential Data and Probability Terms Explained Simply
You and your family were watching a match between India and Australia. Now, let’s say you're interested in knowing who won the match. You asked your father, and he informed you that team A has a chance of winning. Here, the term chance introduces the probability. There is an outcome for every event. Probability refers to these outcomes.
You then wanted to know how many wickets Team India has lost so far and the number of runs achieved by an Indian player. Your father informed you that he needed to double-check the data. So you're wondering, what exactly is data? Data is simply a collection of information. In this article, we will learn about the data and probability in detail.
What is Data?
Data is a collection of information gathered by observations, measurements, research, or analysis. It may comprise facts, figures, numbers, names, or even general descriptions. It is a collection of facts predicted with total certainty. We can best find its chances by looking at how likely they are to happen, with the idea of probability.
What is Probability?
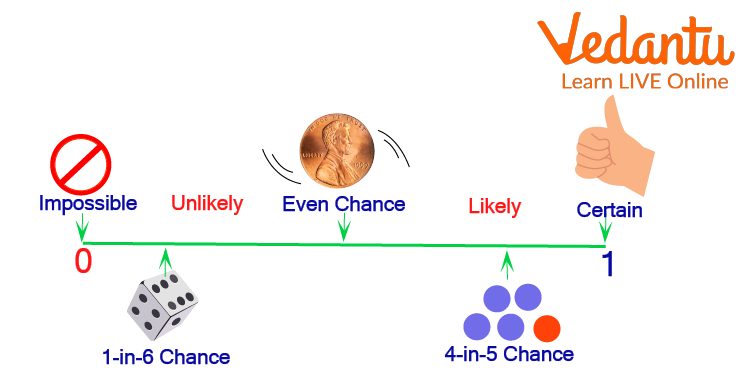
Probability defines the likelihood of the occurrence of an event. There are many real-life situations in which we may have to predict the outcome of an event. We may be sure or not sure of the results of an event. In such cases, we say there is a probability of this event occurring or not occurring.
Probability is a mathematical and scientific term that describes the possibility or occurrence of an event. When a coin is tossed, for example, there is a chance that it will land on its head or tail, or we can say the probability of coming head or tail will be $\dfrac{1}{2}$.
Probability Examples in Real Life
Tossing a Coin:
When a coin is tossed, there are only 2 possibilities: Head(H) or Tail(T).
So we can say that the probability of a head landing on top is $\dfrac{1}{2}$.
Also, the probability of the tail landing on top is $\dfrac{1}{2}$.

Tossing a Coin
Throwing a Die:
When a single dice is thrown, there are 6 possible outcomes 1, 2, 3, 4, 5, and 6. Hence the probability of any number coming on top is $\dfrac{1}{6}$.

Throwing a Dice
Basic Probability Formula
In general, we can derive a theoretical formula for probability as follows:
$\text { Probability of an event occurring }=\dfrac{\text { Number of Favourable outcomes }}{\text { Total number of outcomes }}$
Also, the experimental probability is found when an experiment is performed.
$P(\text { Event })=\dfrac{\text { Total number of favourable outcomes of an event }}{\text { Total number of times the experiment is made }}$
For example, if you toss a coin 10 times, and heads occur 4 times, then
$P(Head)=\dfrac{4}{10}$
$P(Tail)=\dfrac{6}{10}$
Probability
For example: Suppose there is a probability activity in which we have a bag with 5 red and 2 blue balls. Find the probability of taking out a red ball.
Here the total number of balls is 5+2=7
The number of red balls is 5.
As we know that the, $\text { Probability of an event occurring }=\dfrac{\text { Number of Favourable outcomes }}{\text { Total number of outcomes }}$
Therefore, on substituting the values, we get
P(Red ball) =$\dfrac{5}{7}$
Hence the probability of getting a red ball is $\dfrac{5}{7}$.
Solved Examples
Q 1. Find the probability of chances of rolling a “2” with a die.
Ans: The number of ways a dice will roll “2” is ‘1’.
Since there is only 1 face with ‘2’ on it.
Hence, the total number of outcomes = 6
As we know that the, $\text { Probability of an event occurring }=\dfrac{\text { Number of favourable outcomes }}{\text { Total number of outcomes }}$
A dice has 6 faces.
Therefore, on substituting the values, we get
P(Rolling a 2)= $\dfrac{1}{6}$
Hence by formula, its probability will be $\dfrac{1}{6}$
Q 2. A dice is thrown. What is the probability of getting an even number?
Ans: When a dice is thrown, the total number of outcomes is 6.
Now, chance of getting an even number = (2,4,6) = 3
Hence the probability of getting an even number is $\dfrac{3}{6}$, and that is $\dfrac{1}{2}$.
Practice Questions
Q 1. There are 6 candies in a jar. 3 are blue, 2 are red, and 1 is yellow. What is the probability of picking red candy? (Ans: $\dfrac{1}{3}$)
Q 2. Suppose there are 12 marbles in a bag, 7 are red, and 5 are blue. What is the probability of red marble? (Ans: $\dfrac{7}{12}$)
Summary
In this article, we have seen what probability and data are. As we have seen, probability is just the chance of something occurring. When we are uncertain about the result of an event, we might discuss the probabilities of several outcomes—how likely they are. At the same time, data is the collection of information. For example, we need data like a coin or a die to make certain things happen. Later on, we saw some solved examples and practice problems. After going through the article, make sure you give it a try to practise the problem, as it will help you to understand the topic much better.
FAQs on Data and Probability Made Easy: Concepts, Examples & Practice
1. What is the meaning of data in the context of mathematics?
Data refers to a collection of facts, figures, observations, or information gathered through measurements, surveys, or experiments. In mathematics, especially in chapters like Data and Probability, data is used to analyse situations and make predictions or estimations based on available information.
2. How does probability help us understand uncertain events in daily life?
Probability provides a way to measure how likely an event is to occur. It allows us to estimate the chances of everyday uncertain events, such as getting heads in a coin toss or predicting the outcome of a cricket match, by assigning a number between 0 and 1 to each possible event.
3. What is the basic formula for calculating the probability of an event?
The probability of an event is calculated using the formula:
- Probability of an event = (Number of favourable outcomes) / (Total number of possible outcomes)
This formula helps to determine the likelihood of any specific event occurring in an experiment.
4. Can you give an example of finding probability using real-life objects?
Yes. If there are 7 balls in a bag (5 red and 2 blue), the probability of drawing a red ball is:
- Number of favourable outcomes = 5 (red balls)
- Total number of outcomes = 7 (total balls)
Probability of drawing a red ball = 5/7
5. What are the practical uses of probability in various fields?
Probability is widely used in fields like weather forecasting, insurance, risk assessment, games of chance, sports analysis, and medical research. For example, meteorologists use probability to predict rain, and researchers use it to estimate the risk of health conditions.
6. How can data be organised before calculating probability?
Data can be organised using tables, tally marks, or frequency distributions. This organisation helps in clearly identifying all possible outcomes and counting favourable outcomes, which is essential for accurate probability calculations as per the CBSE 2025–26 syllabus.
7. Why does the sum of probabilities of all possible outcomes in an experiment always equal 1?
The sum equals 1 because one of the possible outcomes must occur in every experiment, making the total certainty represented mathematically as probability = 1 (or 100%). This is a key property of a probability distribution.
8. How is probability different from certainty and uncertainty?
Probability measures the likelihood of an event (between 0 and 1), while certainty refers to an event that is sure to happen (probability 1), and uncertainty to an event that may or may not happen (probability between 0 and 1). If probability is 0, the event is impossible; if it is 1, the event is certain.
9. What misconceptions do students often have about calculating probability?
A common misconception is thinking that the outcomes must be equally likely even when they are not. For example, not all candies in a jar may have the same chance of being picked if their shapes or sizes differ. The CBSE syllabus stresses recognising such real-life limitations in theoretical probability.
10. How is probability used to make predictions in data science and statistics?
In data science and statistics, probability is used to model uncertainty and make reliable predictions or decisions based on available data. It underpins concepts like predicting trends, estimating risks, and drawing conclusions from sample data as per statistical methodology taught in school mathematics.