


Master Pedigree Analysis: Tips to Trace Genetic Traits in Class 12 Biology for 2025-26
You must have heard about the royal disease. Queen Victoria of England was a carrier of haemoglobin B. She passed this trait of haemophilia B to her three children out of nine. Do you know about pedigree? A pedigree is a record of the inheritance of some genetic traits for two or more generations in the form of a diagram called a pedigree. Now this pedigree chart is used to find out these inherited disorders. That's why close relatives are advised to not marry. Because it may lead to the expression of some recessive characteristics.
Table of Content
Aim
Articles Required
Theory
Procedure
Observations
Result
Precautions
Lab Manual Questions
Viva Questions
Practical Based Questions
Conclusion
Aim
The experiment aims to prepare and study pedigree charts of any one of the genetic traits such as rolling of tongue blood groups, earlobes, widow's peak, and colour blindness
Articles Required
Information about the above-mentioned traits in the family
Theory
Pedigree
Pedigree is the record of genetic traits for two or more generations in the form of a family tree.
There are different symbols used for human pedigree. Some of these symbols are explained below:
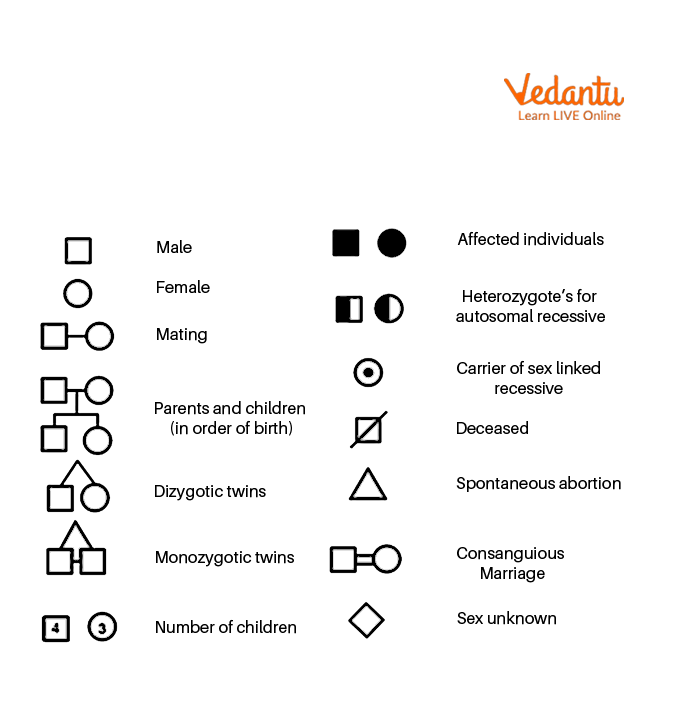
Symbols used in pedigree analysis
Different symbols used for pedigree analysis
A square represents male
Circle represent female
Parents are represented by horizontal lines whereas
Children are represented by the vertical line
The shaded symbol represents a trait under study
Each generation is represented by roman numerals.
Procedure
Select a family with any one of the traits such as ear lobes, widow peak, colour blindness, blood group
Ask questions from family members who exhibit these traits in their family
Prepare a pedigree chart based on information collected from the family
Then at the end examine the pedigree chart carefully whether traits are autosomal, sex-linked, recessive, or dominant
Problem 1- Inability to Roll Tongue
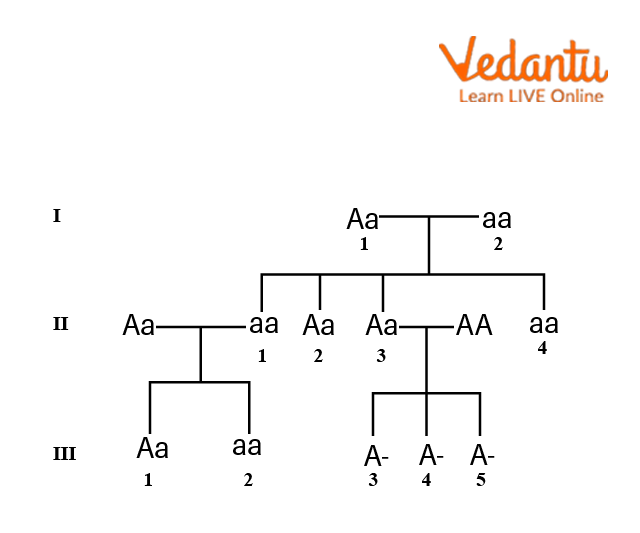
The trait of inability to roll the tongue appears in the progeny due to recessive genes. Now we have to find out the possible genotypes of these family members.

Pedigree chart
Solution: Now we can see in this pedigree chart that the father has the trait of the inability of rolling the tongue so the genotype of the father in 1st generation is homozygous recessive. Now one of the children in 2nd generation has this trait so she must be homozygous recessive and the remaining children in 2nd generation are heterozygous recessive. So mothers in the 1st generation would be heterozygous recessive. Now, the 2nd child in the 3rd generation has this trait, so she would be homozygous recessive. 1st Children of the 3rd generation would be heterozygous recessive and 3rd, 4th, and 5th children of the 3rd generation may be heterozygous or homozygous.
It is an example of an autosomal recessive pedigree.
Solution of pedigree chart of inability to roll tongue trait
Problem 2 - Widow Peak
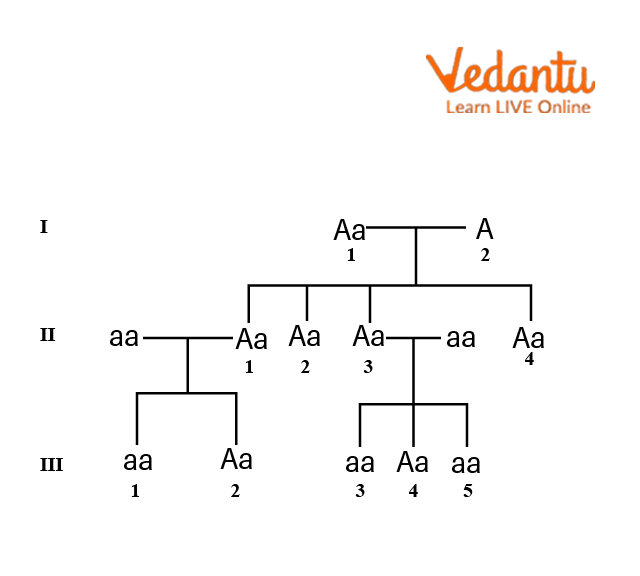
The pedigree chart for a particular family is given below. Indicate whether the shaded symbols belong to dominant or recessive traits.

Pedigree chart of widow peak trait
Solution: Since the shaded symbols appear in all offspring, the father must be homozygous dominant and the mother homozygous recessive because in all other cases the possibility is absent. All the members of the 2nd generation will be heterozygous. This is further confirmed by the marriage of II-I with homozygous recessive-bearing children of both parental types. Marriage of II-3 with the homozygous recessive can produce both recessive and heterozygous.
Solution of widow peak trait
Observations
Genotypes of various members of the family for a particular trait have been observed.
Results
The pedigree charts of two families have been studied.
Precautions
First, carefully analyse the family tree and then write the genotypes.
Lab Manual Questions
Q1. What is a pedigree?
Ans: A pedigree is a record of the inheritance of a particular trait over two or more generations in a given family.
Q2. What does a horizontal line represent in a pedigree?
Ans: Horizontal line represents parents in a pedigree.
Q3. What is the importance of pedigree analysis?
Ans: Pedigree analysis helps in knowing the possibility of the presence of a particular trait in a homozygous or heterozygous state in family members.
Viva Questions
Q1. What is pedigree analysis?
Ans: It is a process of analysing the inheritance pattern of a family member over several generations to show the origin of a trait.
Q2. What is the conclusion of pedigree charts?
Ans: Pedigree chart can conclude the pattern of inheritance, it helps to find out whether the given trait is dominant or recessive or autosomal or sex linked trait.
Q3. What is linkage?
Ans: Linkage is defined as the closeness of genes to one another on the chromosome. The more the closeness between the genes on a chromosome, more will be the linkage.
Q4. What are mendelian disorders?
Ans: Mendelian disorders are the disorders that appear due to abnormalities in genes, or chromosomes. Examples of Mendelian disorders are cystic fibrosis and sickle cell anaemia.
Q5. What is the purpose of pedigree?
Ans: The main purpose of a pedigree chart is to analyse or find out the pattern of inheritance of a particular trait in a given family.
Q6. Give an example of an autosomal dominant pedigree
Ans: Autosomal dominant diseases include - Huntington's chorea and marfan syndrome. In Huntington's disease nerve cells of the brain break over time.
Q7. Colour blindness pedigree chart given in practical book is dominant or recessive?
Ans: Colour blindness is a X- linked recessive disorder.
Q8. What is a pedigree chart called?
Ans: Pedigree chart is also called a family tree.
Practical Based Questions
Q1. What does the symbol square represent in a pedigree analysis?
Female
Male
Both
None of the above
Ans: 2. Male
Q2. What are different types of genotypes?
Homozygous dominant
Homozygous recessive
Heterozygous
All of the above
Ans: 4. All of the above
Q3. What does the circle represent in pedigree?
Male
Twin
Female
None of the above
Ans: 3. Female
Q4. What does horizontal line represent in a pedigree?
Children
Marriage
Divorce
All of the above
Ans: 2. Marriage
Q5. What does a vertical line represent in a pedigree?
Marriage
Children
Separation
None of the above
Ans: 2. Children
Q6. What are genes made of?
DNA
Protein
Carbohydrates
All of the above
Ans: 1. DNA
Q7. What are the sources of genetic variation?
Recombination
Mutation
Both of the above
None of the above
Ans: 3. Both of the above
Q8. There are how many alleles of a gene?
One
Two
Three
None of the above
Ans: 2. Two
Conclusion
We have discussed pedigree and pedigree analysis in this experiment.
Different symbols used for the pedigree analysis also discussed in this experiment
There are many types of genetic disorders, such as homozygous, heterozygous, dominant, and recessive
Two problems of pedigree were also discussed in this experiment, inability of rolling tongue and widow peak.
FAQs on Step-by-Step Guide: Making Pedigree Charts for Any Genetic Trait (Class 12 Biology)
1. What are the essential symbols a student must know to correctly draw and interpret a pedigree chart for the CBSE Class 12 Biology exam?
For the CBSE Class 12 exam, understanding the standard symbols is crucial for any question on pedigree analysis. The most important symbols are:
- Male: A square (☐)
- Female: A circle (○)
- Affected Individual: A shaded square or circle (■ or ●)
- Mating/Marriage: A horizontal line connecting a square and a circle (□—○)
- Offspring: A vertical line descending from the mating line, connected to the children of that generation.
- Generations: Roman numerals (I, II, III) to the left of each generation.
- Consanguineous Mating: A double horizontal line connecting the male and female (□═○), indicating marriage between close relatives.
2. For a 3-mark question, how would you determine if a trait shown in a pedigree chart is dominant or recessive?
To determine if a trait is dominant or recessive, look for these key patterns which are often considered in board exam questions:
- Dominant Trait: The trait does not skip generations. An affected individual will have at least one affected parent. It appears in every generation.
- Recessive Trait: The trait can skip one or more generations. It is common to see unaffected parents having an affected offspring. This indicates that both parents were heterozygous carriers.
A classic indicator for a recessive trait is when two unaffected parents (e.g., in generation I) have an affected child (in generation II).
3. Explain X-linked recessive inheritance with a common example like colour blindness. What are the key indicators to look for in a pedigree chart?
X-linked recessive inheritance is a frequently asked topic. In this pattern, the gene for the trait is located on the X chromosome. Key indicators to identify this in a pedigree chart are:
- It affects more males than females.
- The trait is never passed directly from an affected father to his son, because a father passes his Y chromosome to his sons.
- An affected female will pass the trait to all of her sons.
- The trait often skips a generation, being passed from an affected grandfather to his grandsons through his carrier daughter.
For example, in colour blindness, if a carrier female (XCXc) marries a normal male (XCY), 50% of their sons (XcY) are expected to be colourblind.
4. What are some common Mendelian traits in humans, like tongue rolling or widow's peak, that are frequently used for pedigree analysis in practical exams?
For the Class 12 Biology practical, several easily observable Mendelian traits are used to prepare pedigree charts. Important examples include:
- Widow's Peak: A V-shaped hairline, typically considered an autosomal dominant trait.
- Tongue Rolling: The ability to roll the tongue into a U-shape, also commonly treated as an autosomal dominant trait.
- Attached vs. Free Earlobe: Free earlobes are dominant over attached earlobes (autosomal recessive).
- Blood Groups: The ABO blood group system follows a pattern of codominance and multiple alleles.
- Colour Blindness: An X-linked recessive disorder.
5. Why is it often difficult to distinguish between an X-linked dominant and an autosomal dominant trait in a pedigree, and what evidence would definitively differentiate them?
This is a higher-order thinking question. Both inheritance patterns are similar because the trait appears in every generation. The critical difference, and the key evidence to look for, lies in the transmission from father to child:
- The Decisive Clue: Look for an affected father.
- If an affected father has an unaffected daughter, it rules out X-linked dominant inheritance. An affected father (XAY) must pass his XA to all his daughters, so they would all be affected.
- If an affected father has an affected son, it rules out X-linked dominant inheritance being the only possibility, but strongly suggests autosomal dominant inheritance, as fathers do not pass X chromosomes to their sons.
6. A student observes that a trait skips a generation in a pedigree chart. What can be definitively concluded, and why can't it be a dominant trait?
If a trait skips a generation, it can be definitively concluded that the trait is recessive. This is a fundamental rule in pedigree analysis.
It cannot be a dominant trait because dominant alleles, by definition, express themselves phenotypically even if only one copy is present (heterozygous). Therefore, an individual with a dominant trait must have at least one parent who also has the trait. The trait cannot disappear for a generation and then reappear, which is a hallmark of recessive inheritance where unaffected heterozygous parents can have an affected homozygous offspring.
7. What is the primary purpose of pedigree analysis, and why is it a particularly important tool for studying human genetics?
The primary purpose of pedigree analysis is to trace the inheritance of a specific trait, abnormality, or disease through several generations of a family. It is a crucial tool in human genetics because controlled test crosses, which are possible in plants and other organisms, are not ethically or practically possible in humans. Pedigree analysis allows geneticists to:
- Determine the mode of inheritance (dominant, recessive, autosomal, or sex-linked).
- Predict the probability of an offspring inheriting a genetic disorder.
- Help in genetic counselling for families with a history of inheritable diseases.
8. How does a consanguineous marriage, represented by a double line in a pedigree, increase the probability of an offspring expressing an autosomal recessive disorder?
A consanguineous marriage involves individuals who are closely related, such as first cousins. This significantly increases the chance of an offspring inheriting an autosomal recessive disorder. Here’s why:
Recessive disorders are only expressed in individuals with a homozygous recessive genotype (e.g., aa). Individuals in the same family are more likely to carry the same recessive alleles inherited from a common ancestor. If both parents are heterozygous carriers (Aa) for the same recessive allele, there is a 25% chance (1 in 4) with each pregnancy that their child will be homozygous recessive (aa) and express the disorder. Mating between relatives increases the likelihood that both partners are carriers (Aa x Aa).
9. What are the key steps to prepare a pedigree chart from family information, as expected for a CBSE practical record?
To prepare a pedigree chart for the CBSE Biology practical, you should follow these important steps:
- Select a Trait: Choose one clear monogenic trait to study (e.g., widow's peak, tongue rolling, blood type).
- Gather Information: Interview family members across at least three generations to collect data on who possesses the trait. Start with yourself, your parents, and your grandparents.
- Draw the Chart: Use standard pedigree symbols. Represent males with squares and females with circles. Connect parents with a horizontal line.
- Indicate Affected Individuals: Shade the symbols of all individuals who exhibit the trait being studied.
- Label Generations: Clearly label each generation with Roman numerals (I, II, III...).
- Analyse the Pattern: Examine the completed chart to determine the most likely mode of inheritance (e.g., autosomal dominant, autosomal recessive, etc.) and state your conclusion.